Introducing the Hyperdrive Analytics Dashboard

Together with Block Analitica, we’re excited to announce the launch of a new analytics dashboard for Hyperdrive’s testnet! This marks the achievement of another key milestone in our journey to bring a novel approach to fixed and variable yields to DeFi.
If you’re new to Hyperdrive, check out the intro blog post. Hyperdrive is a new Automated Market Maker (AMM) protocol featuring a novel pricing mechanism for fixed and variable yield positions. In addition to terms on demand, its mechanism design enables more efficient and symmetrical yield markets.
The Hyperdrive Analytics dashboard is a companion dashboard to the Hyperdrive app, enabling anyone to delv deeper into key data insights stemming from the trading activity on the underlying protocol. Monitor risk metrics, uncover growth opportunities, and hypercharge your potential portfolio performance by gleaning new insights into market dynamics. Analytics are presented at the protocol, market, and individual wallet levels!
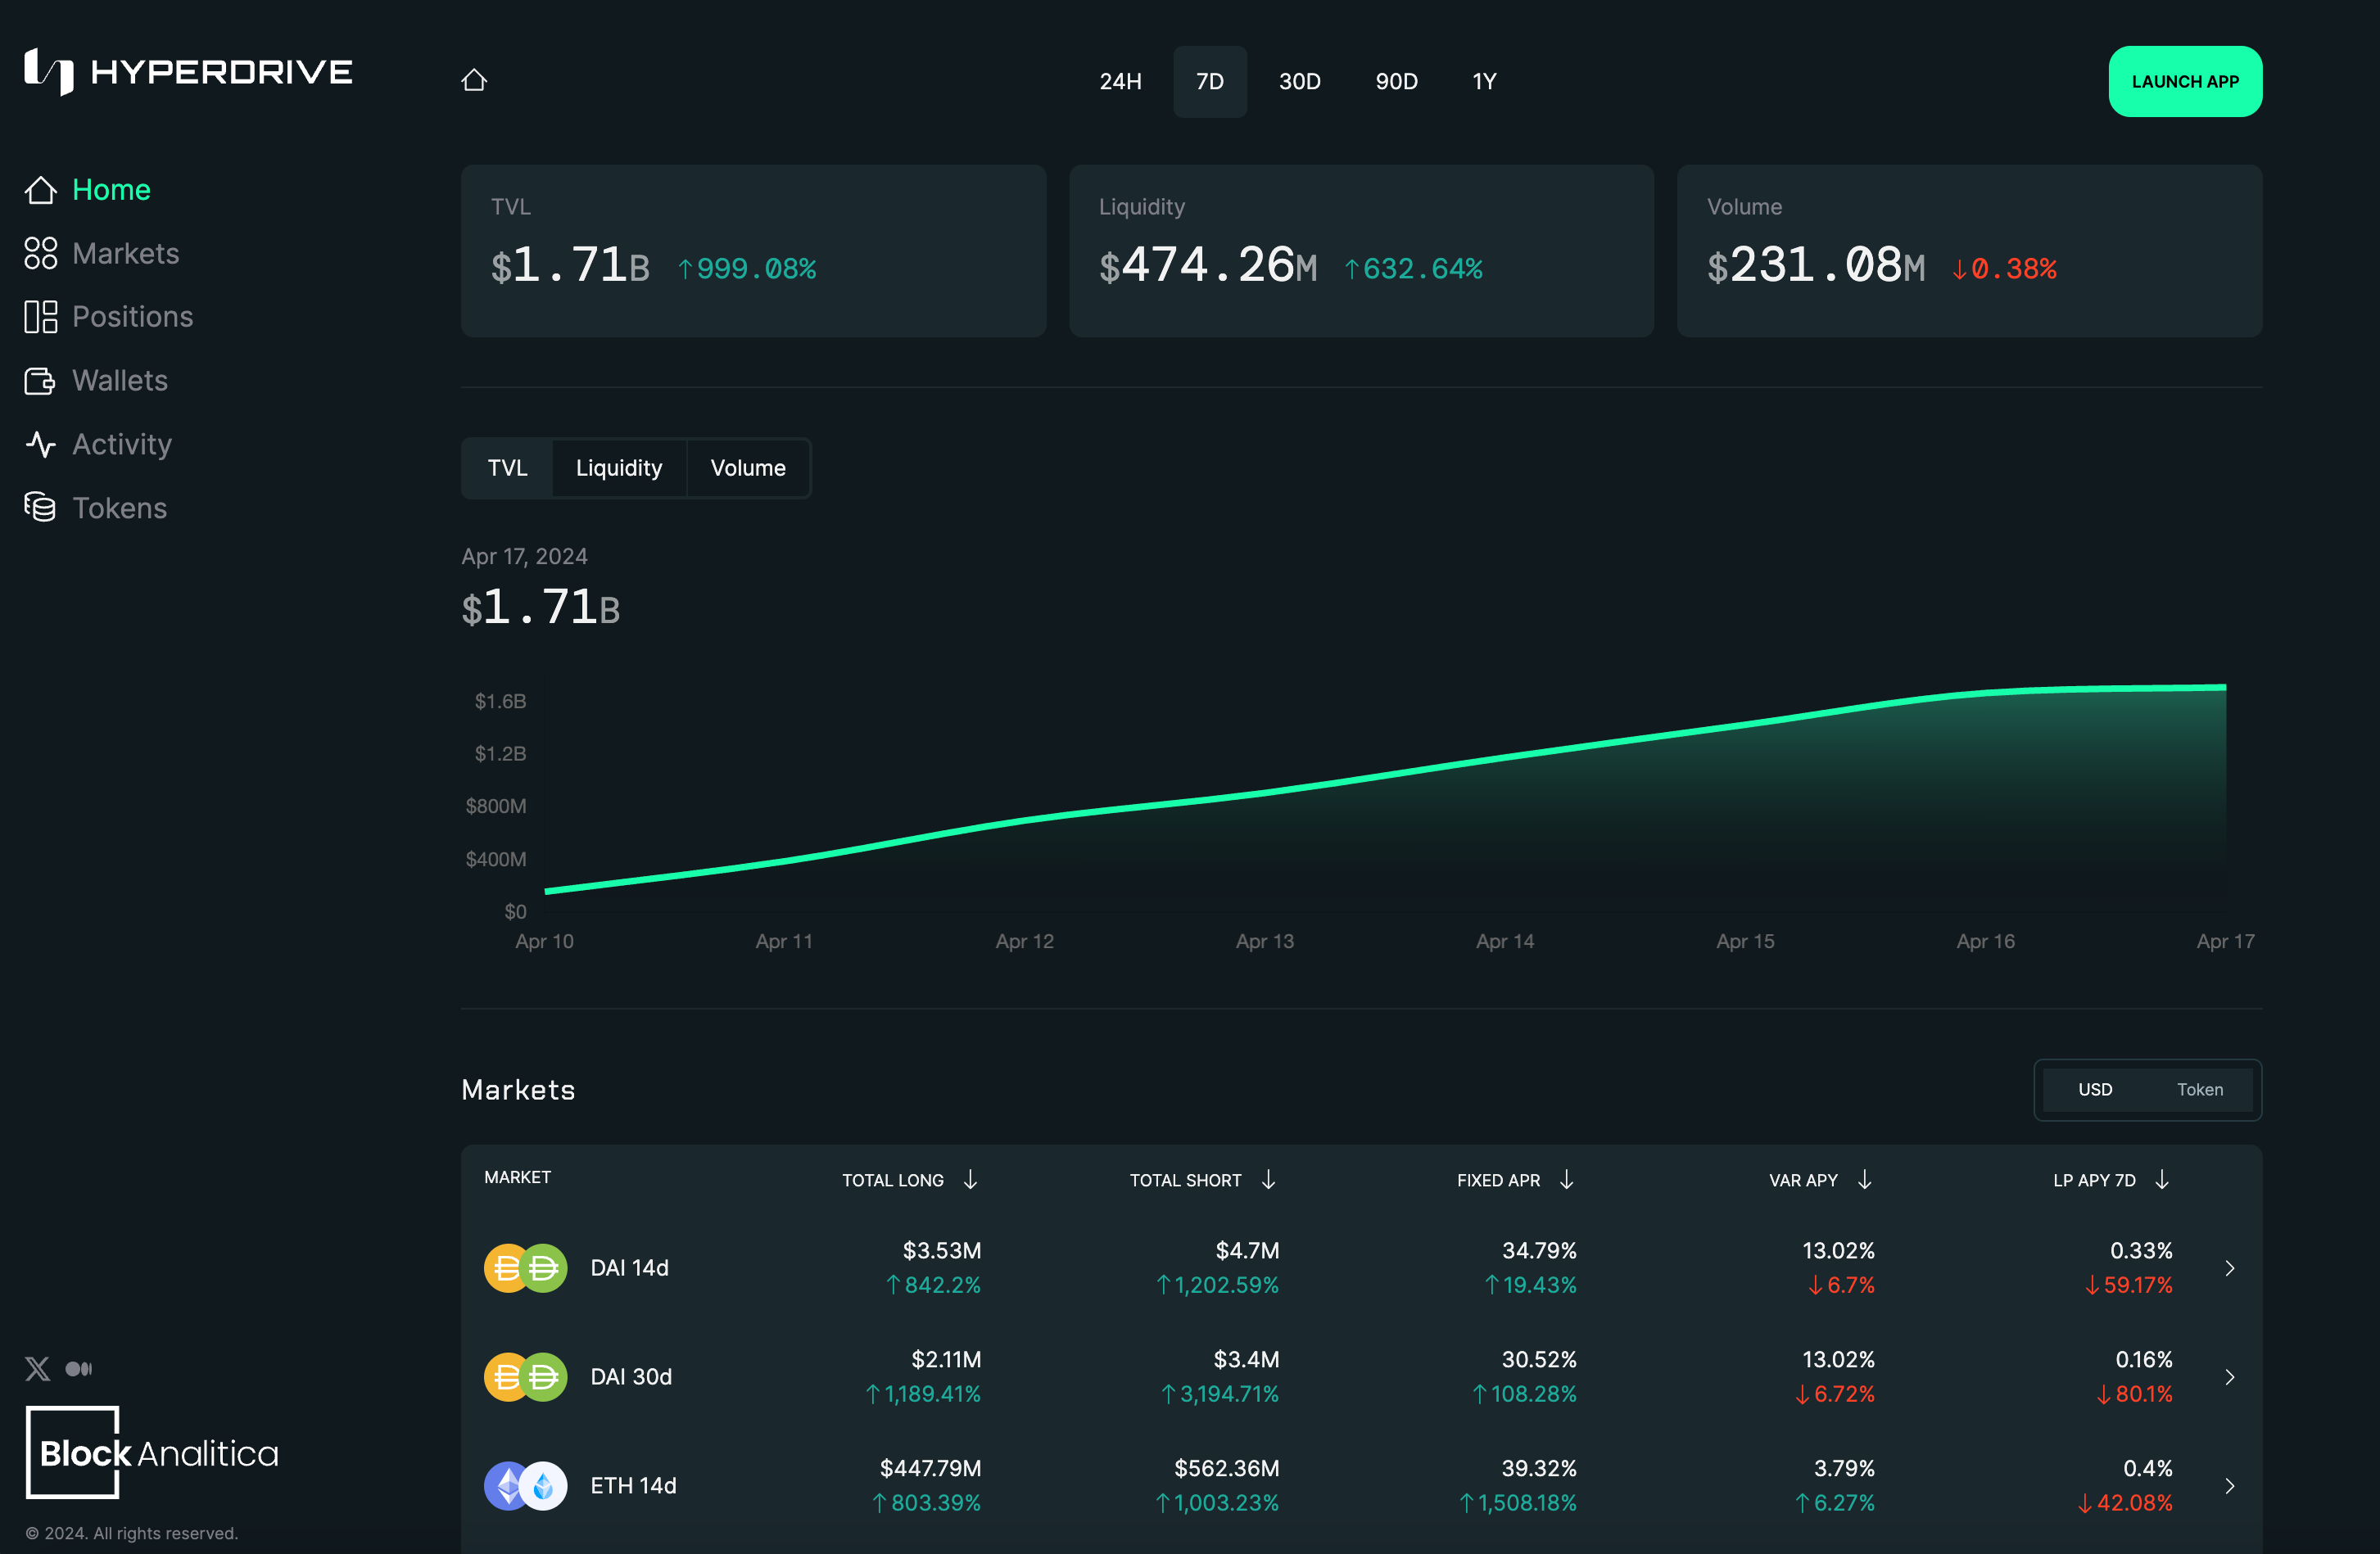
Homepage
Here you can monitor all of the key protocol-level metrics in one place: TVL, Liquidity, and Volume. Use the chart to observe trends across these metrics and change the time frame by using the global time frame selector in the page header. The testnet markets presented in the below chart show key metrics like Longs and Shorts' aggregate position values and Fixed APR, Variable APY, and LP APY for each respective market.
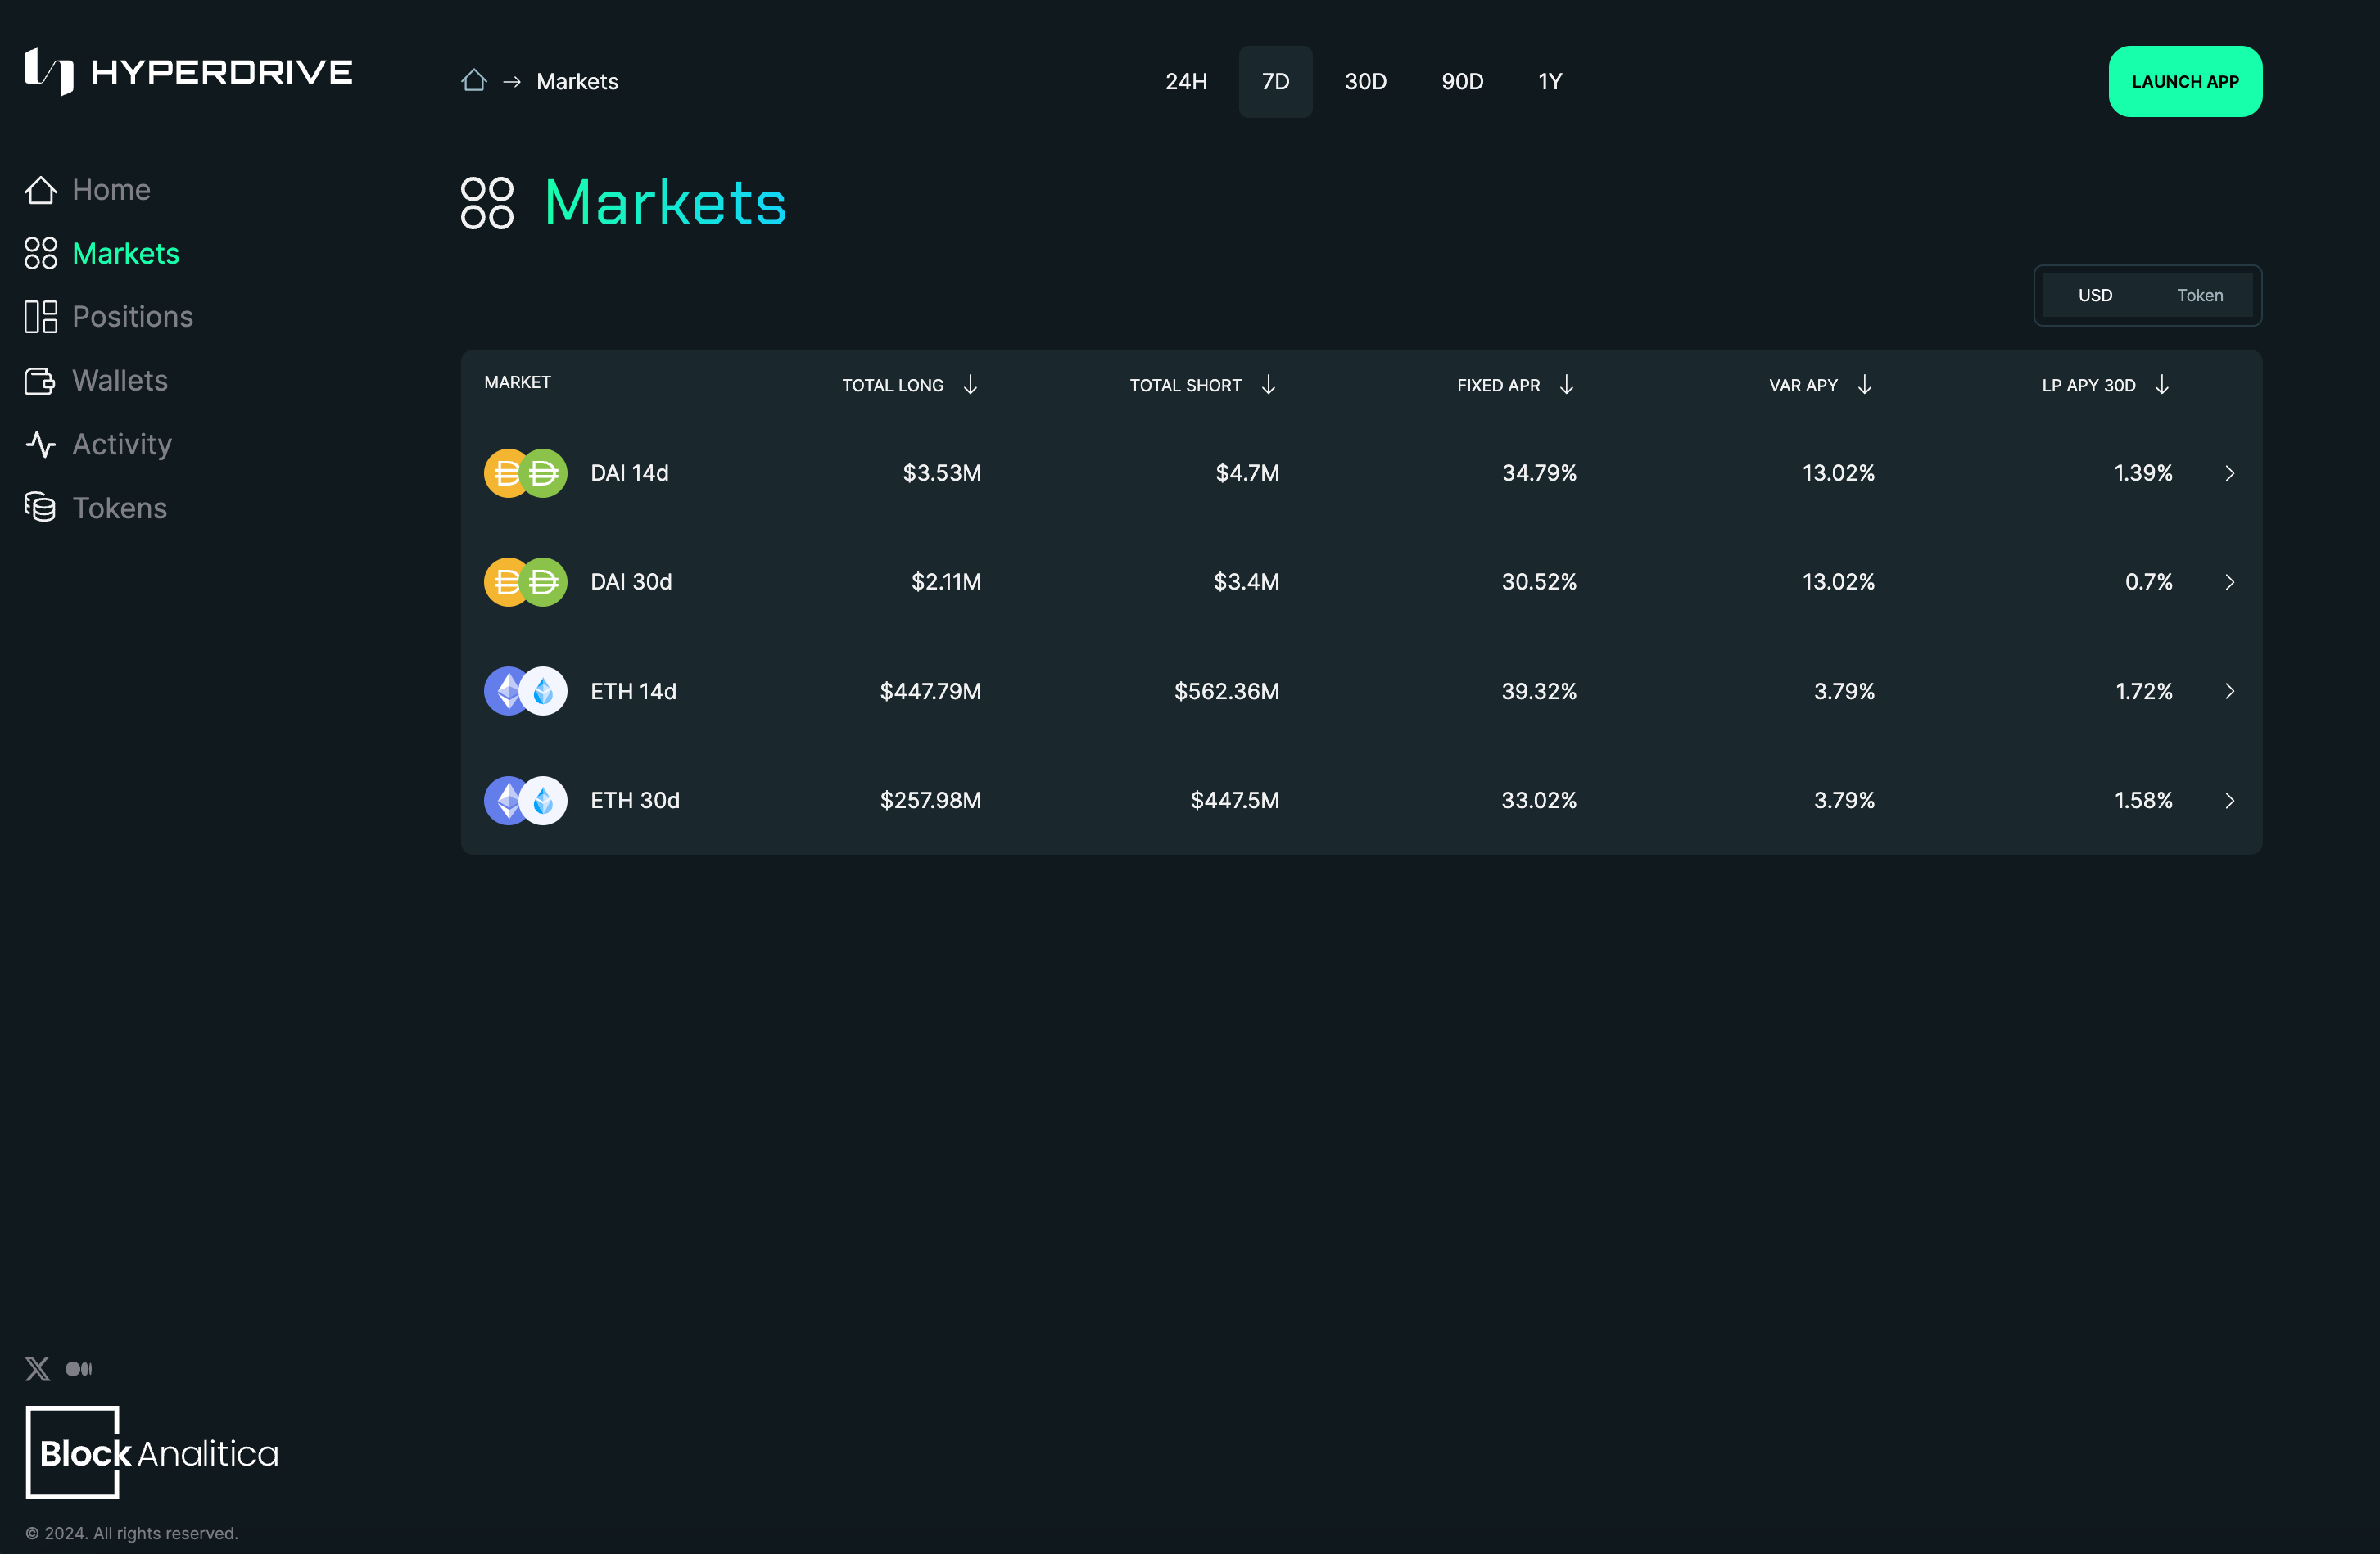
Markets
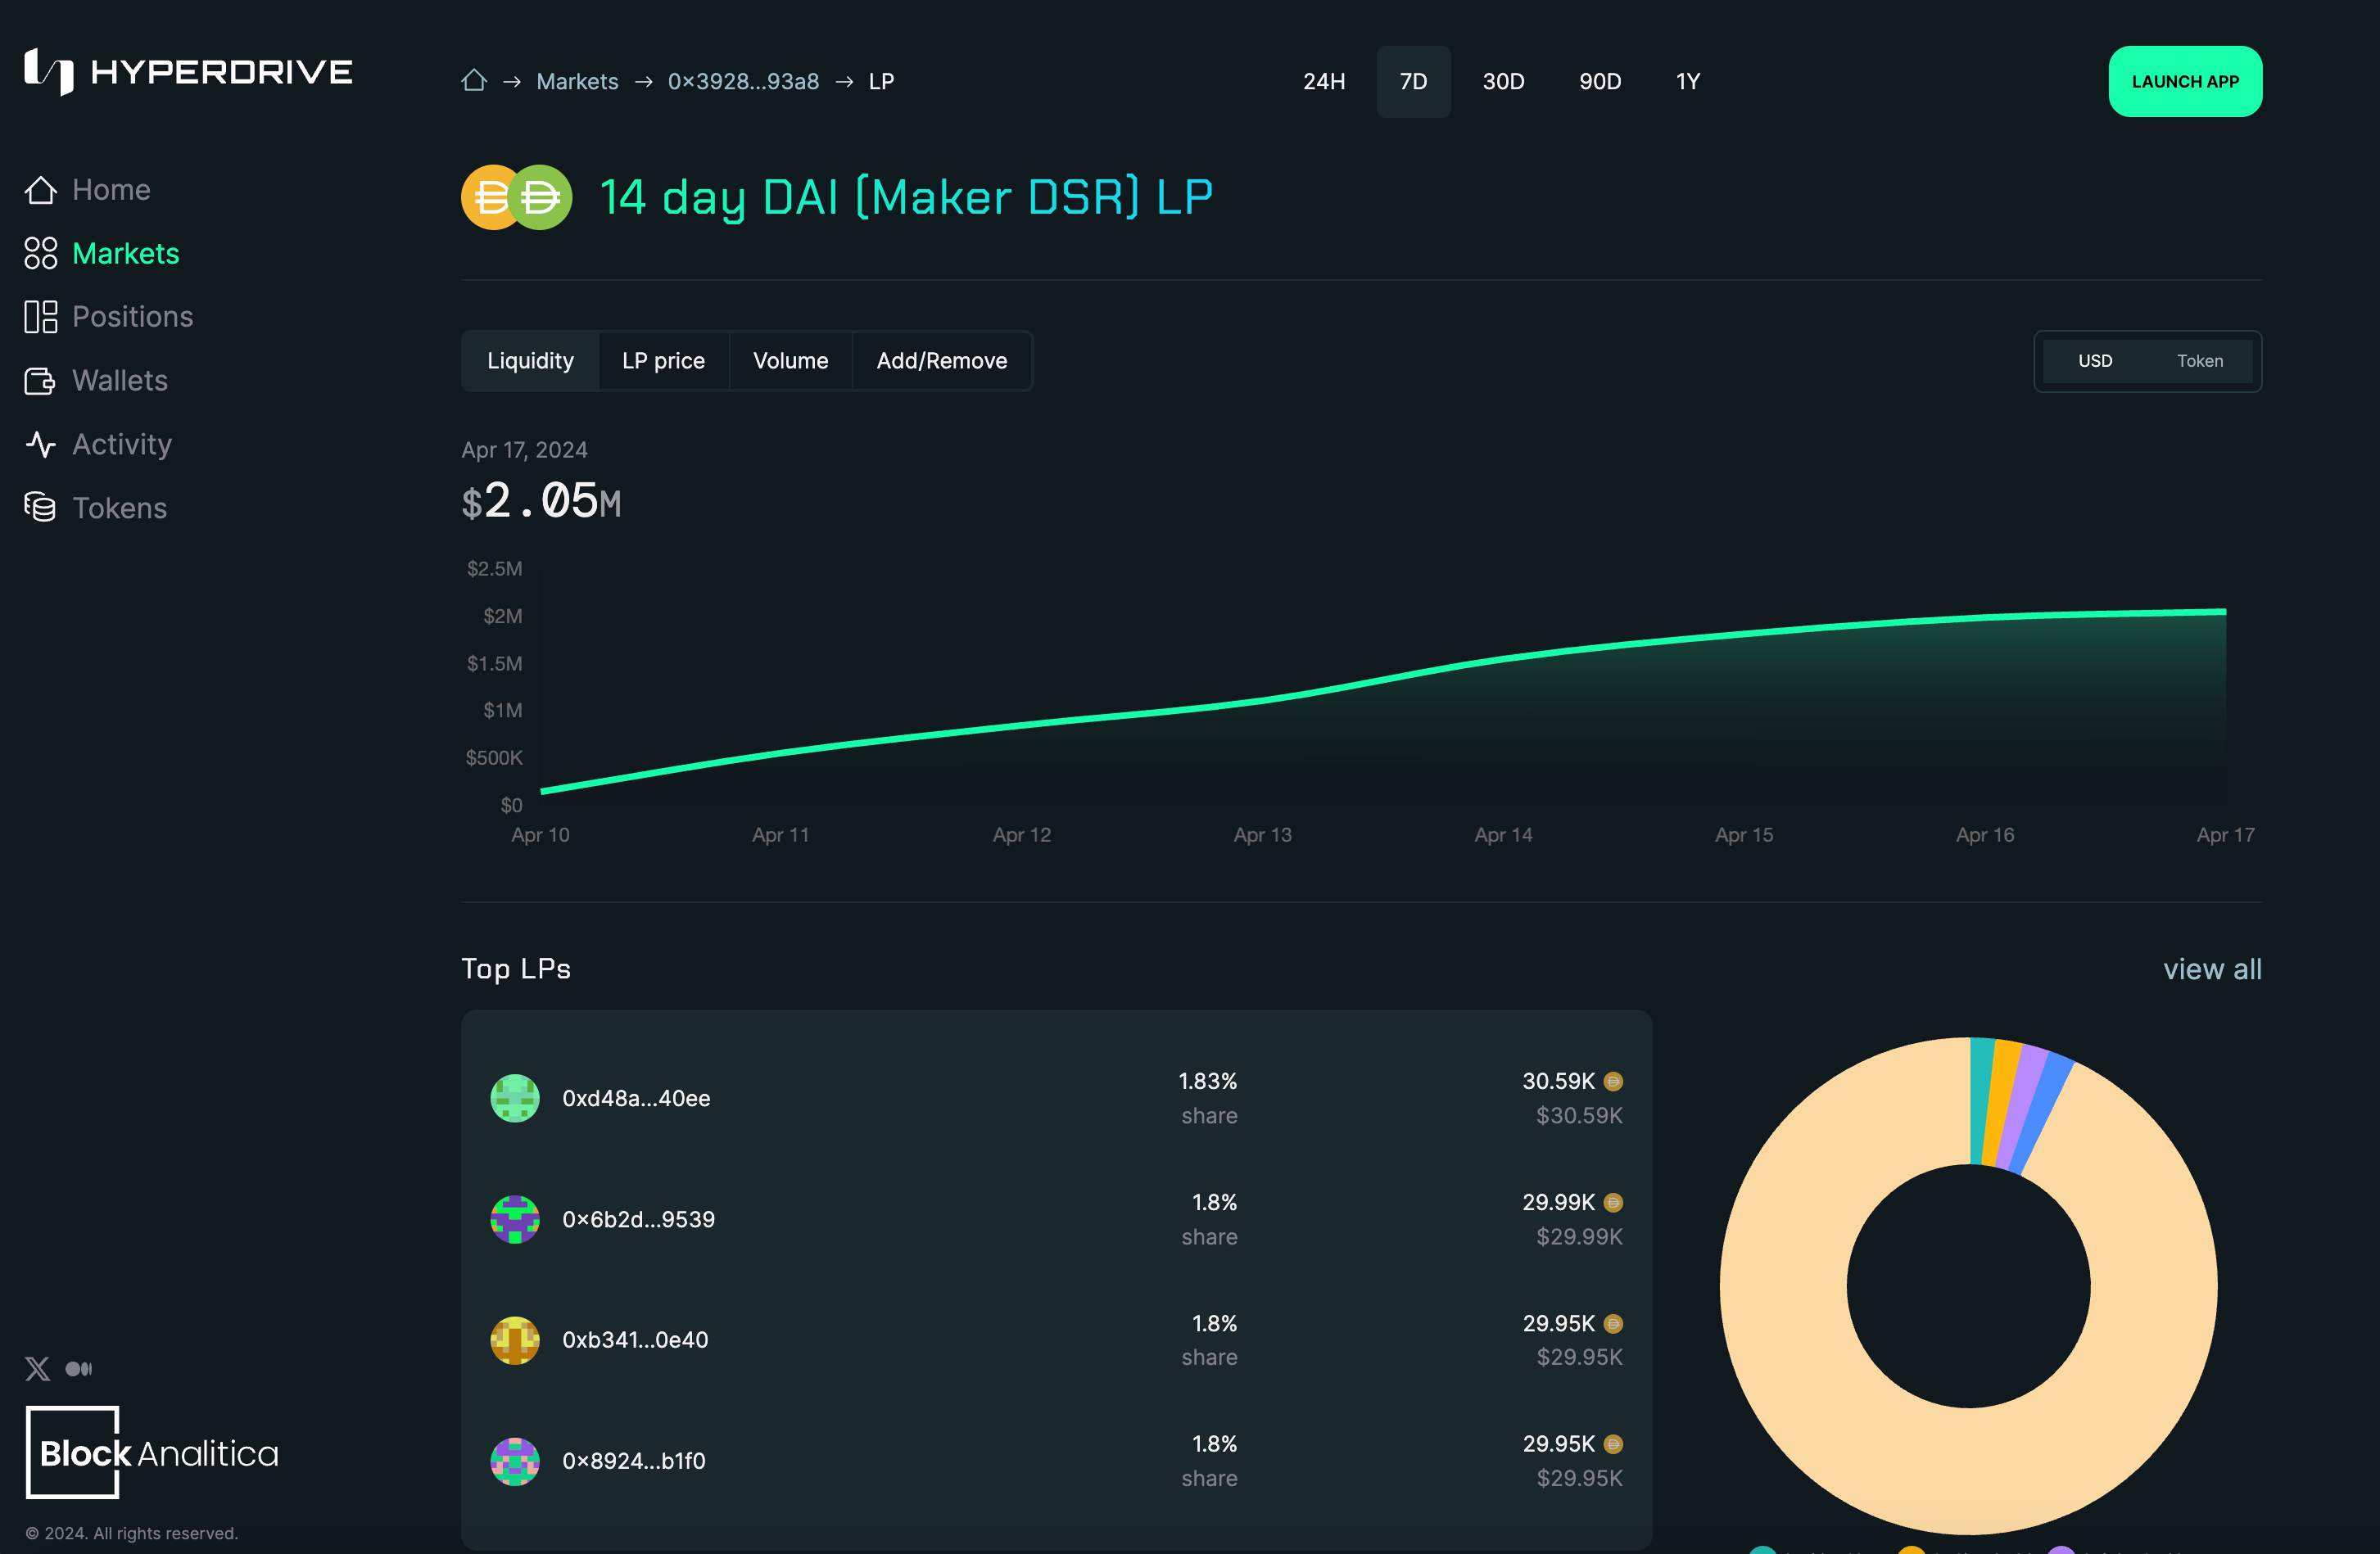
The Markets page presents similar market-specific metrics that are also available on the homepage. Click through a market to see further details. In addition to hy[Token] price (i.e., hyETH or hyDAI, depending on the market selected), you’ll notice a data visualization for market “skew” – the proportion of positions that are Long vs. Short for the specific market in view.
The main chart overview contains toggles for Liquidity, Open Longs, and Open Shorts – get a feel for these by toggling them on/off to view each in isolation or together.
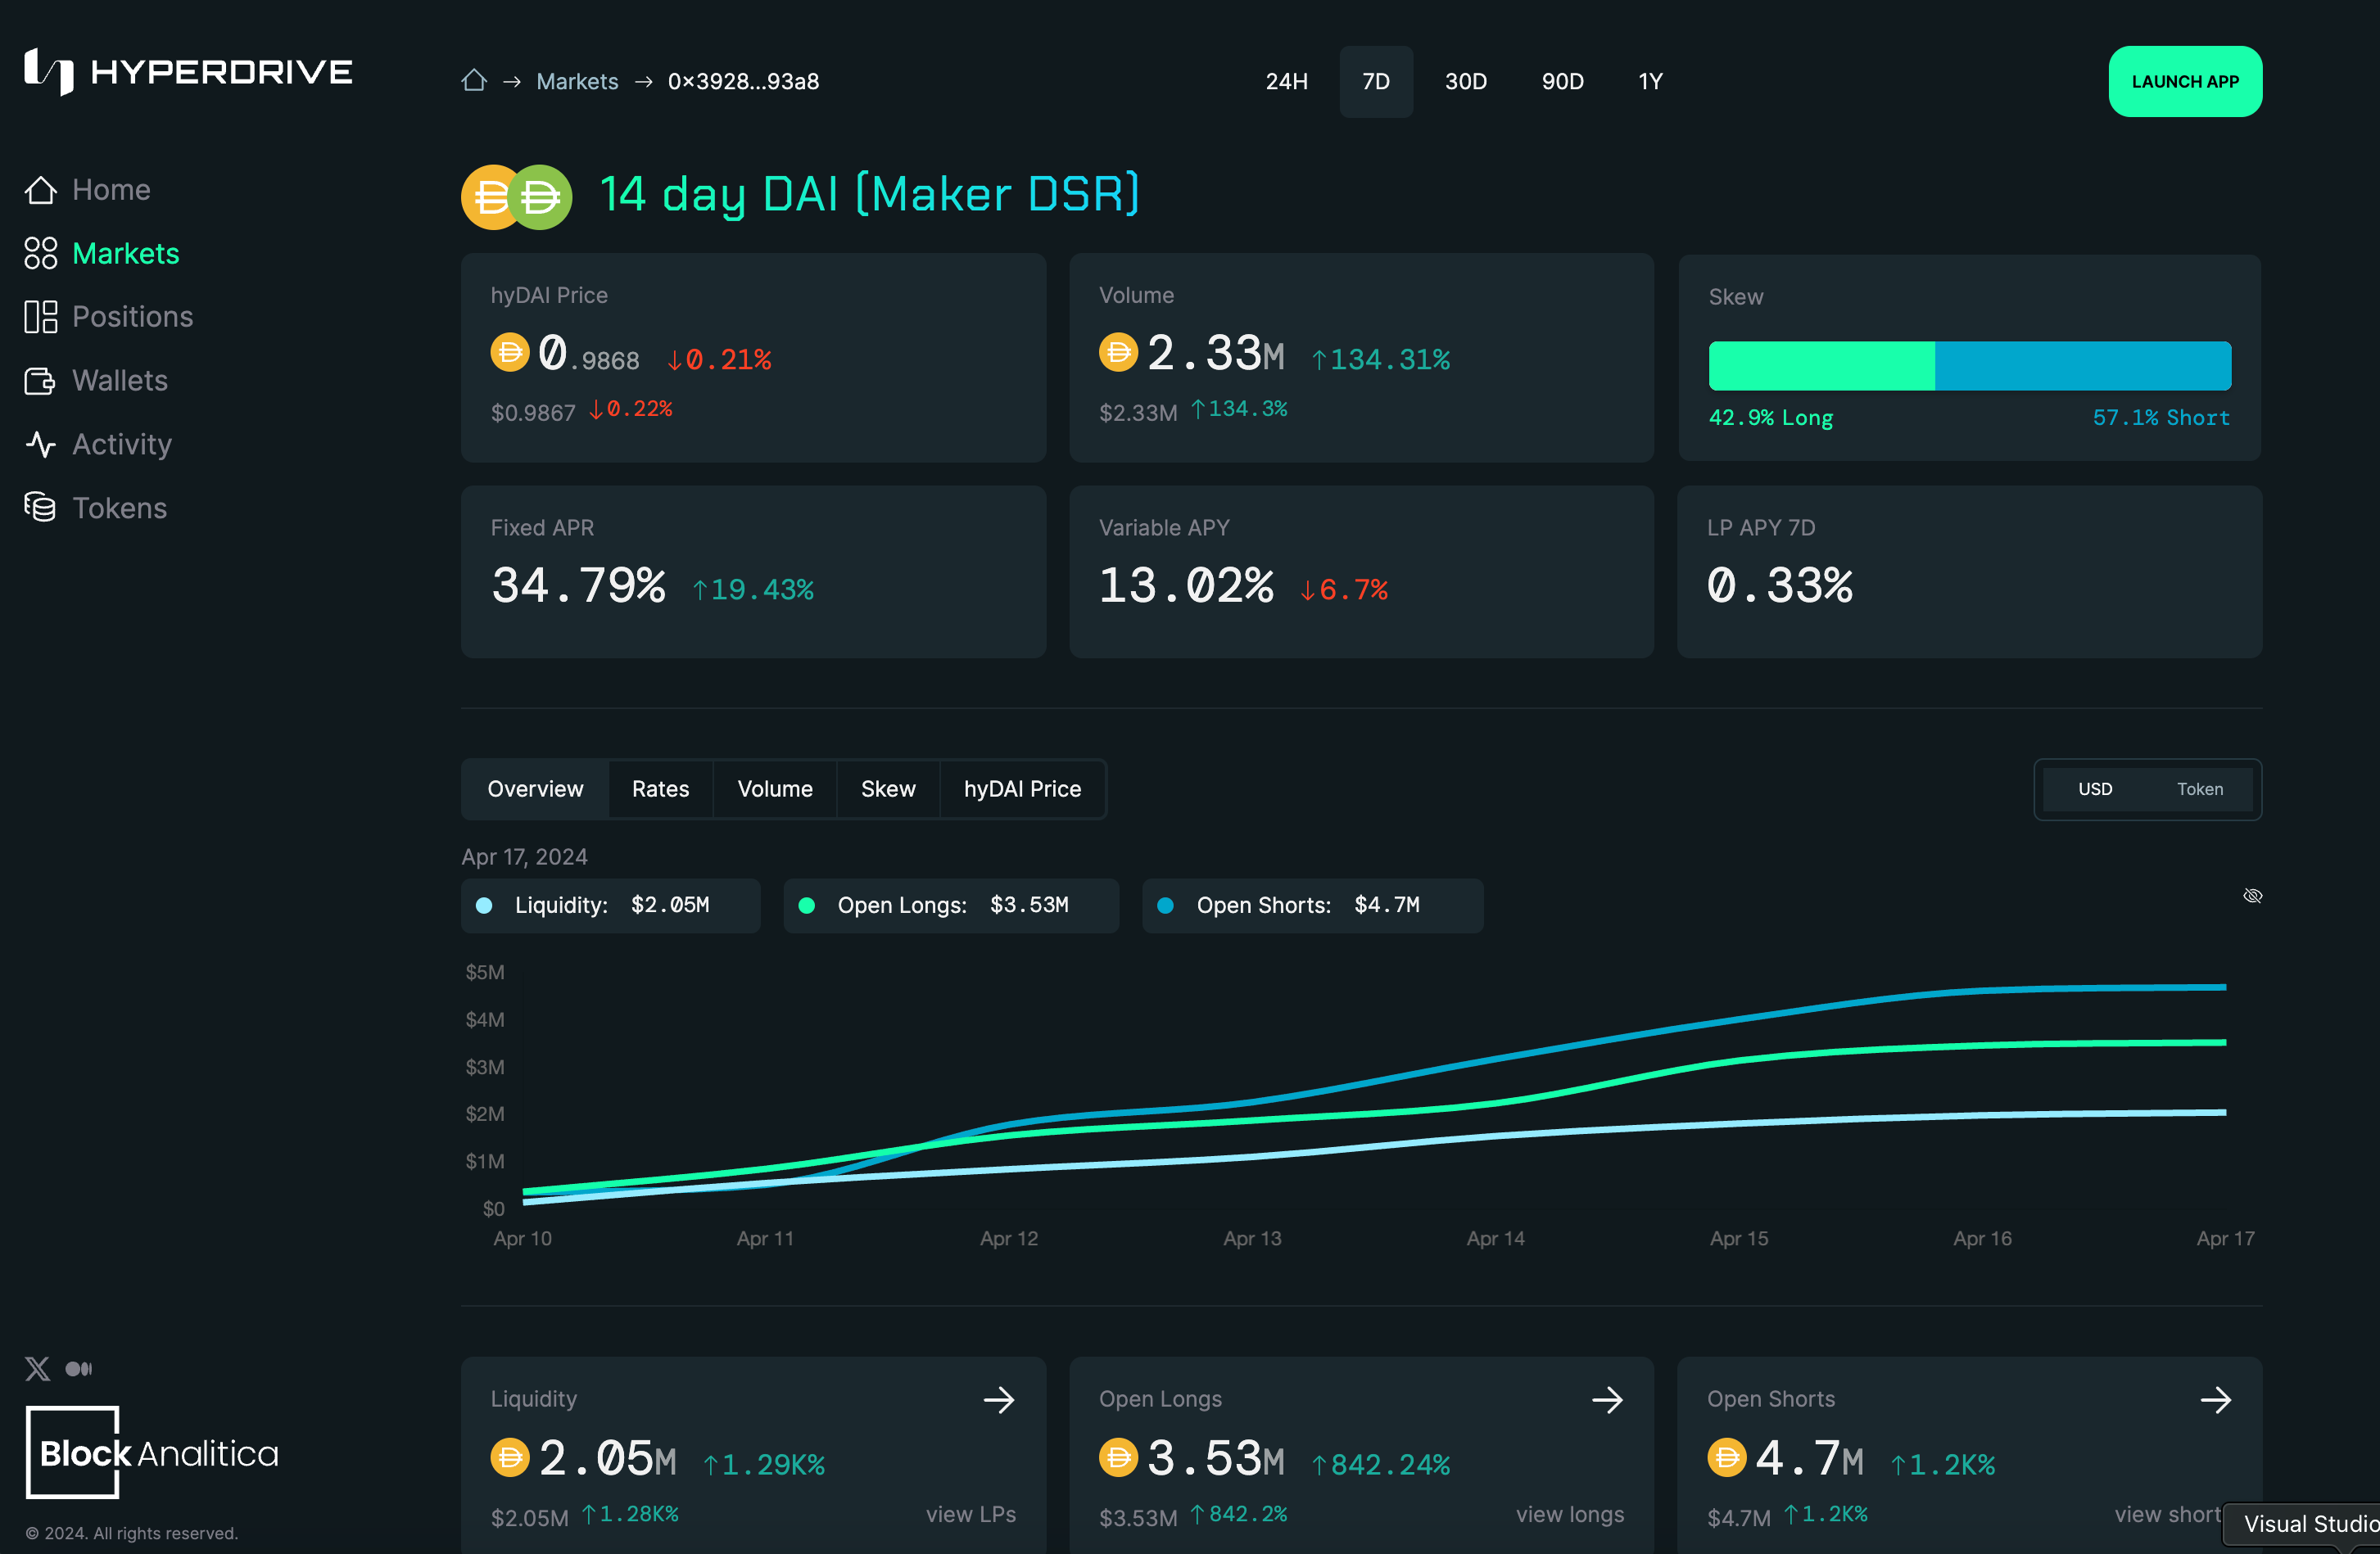
Below the chart you’ll see additional boxes with metrics for the same: Liquidity, Open Longs, and Open Shorts – click through each one to see more insights and data visualizations.
Positions
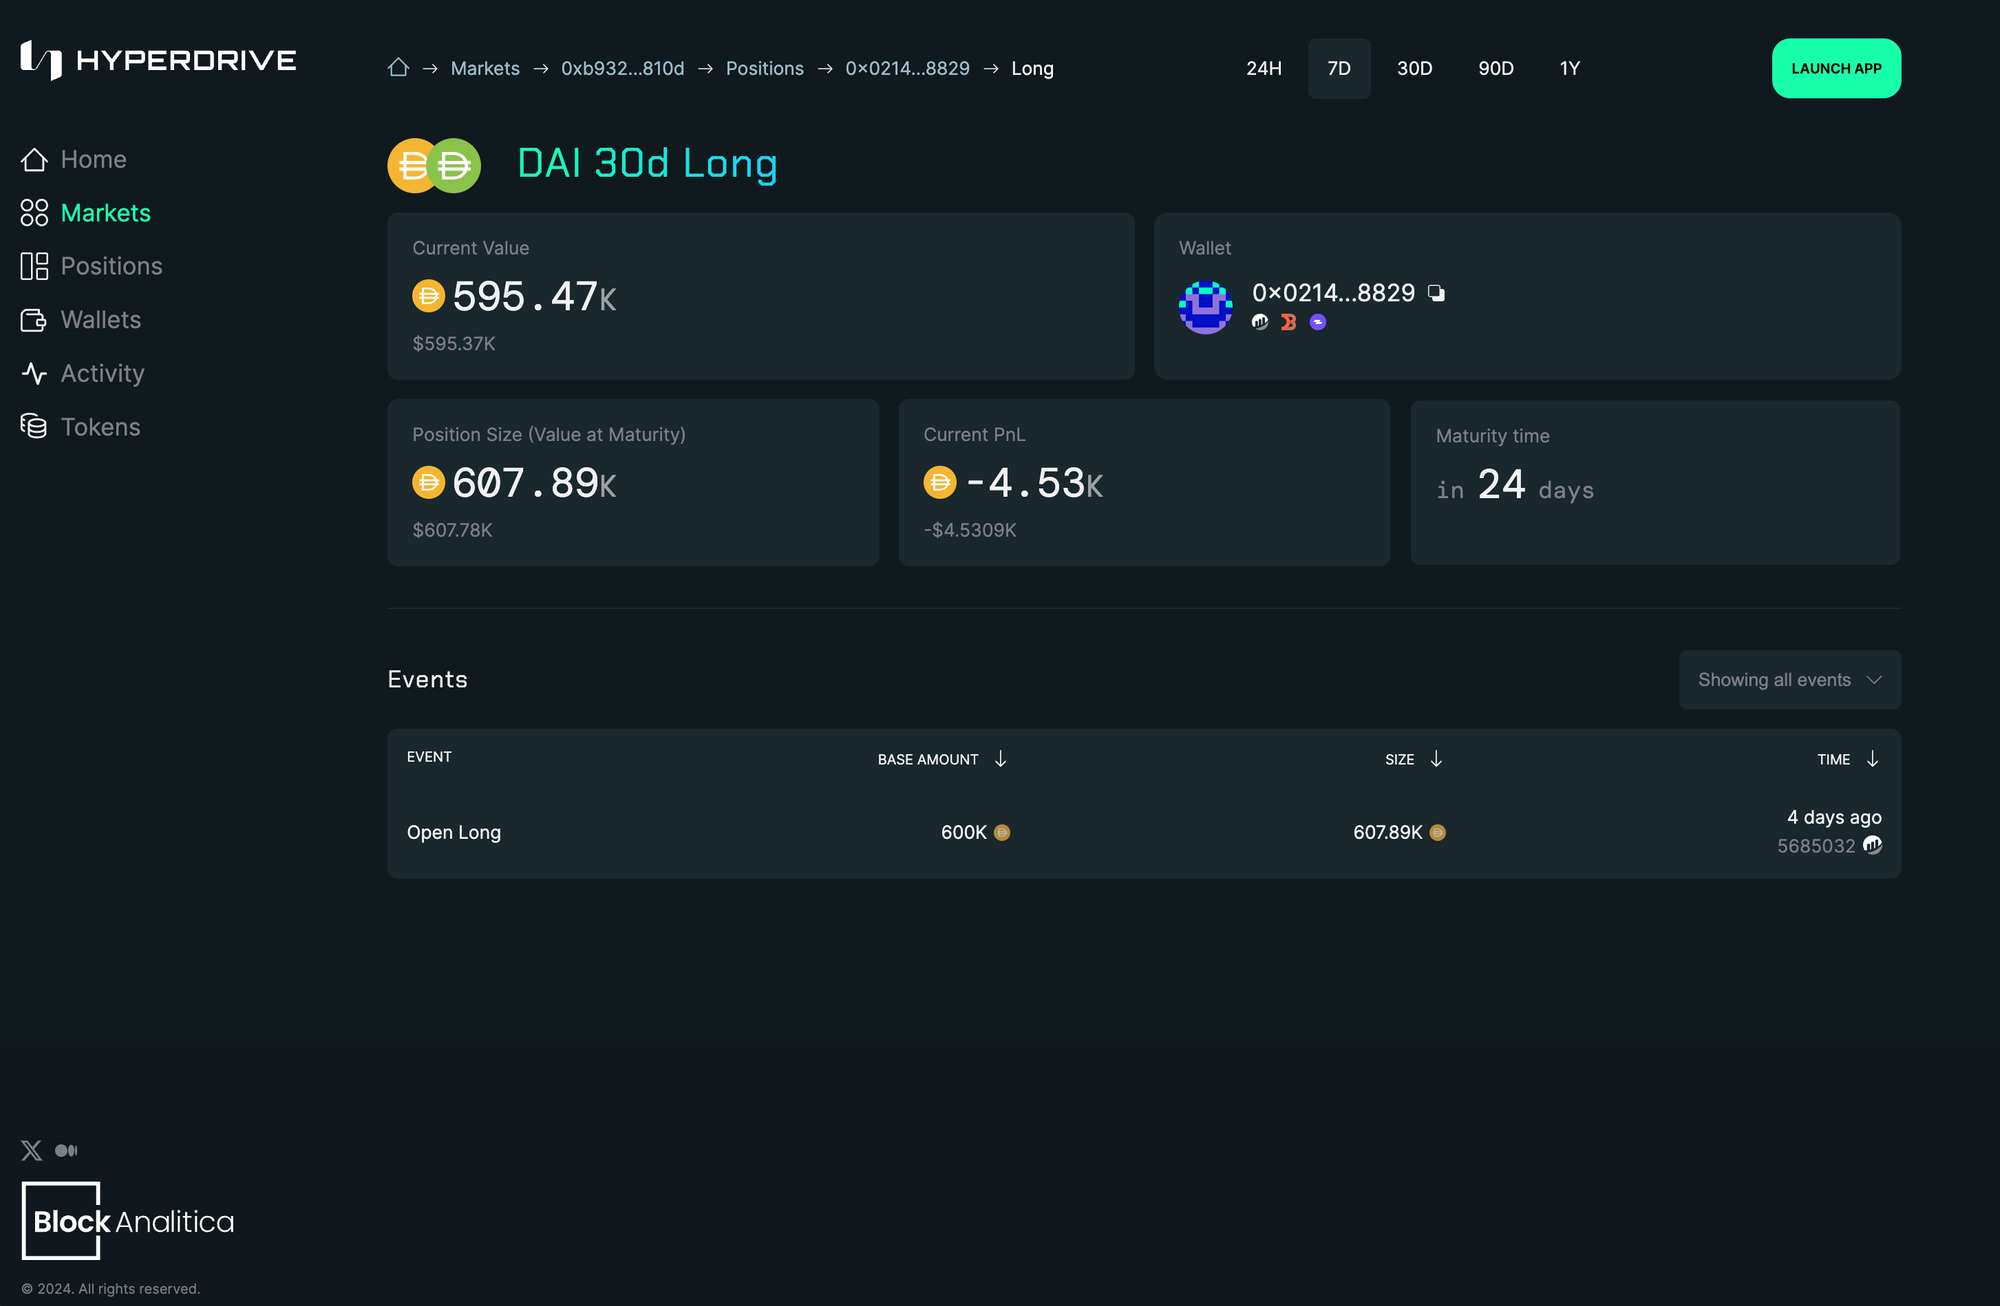
Selecting the ‘Positions’ page from the left navigation panel will take you to a full list of all positions opened (or closed) across all markets. View by Long, Short, or LP, and use the filters to view by a specific market. Enter a wallet address to see only relevant positions (open or closed) for a specific wallet of interest.
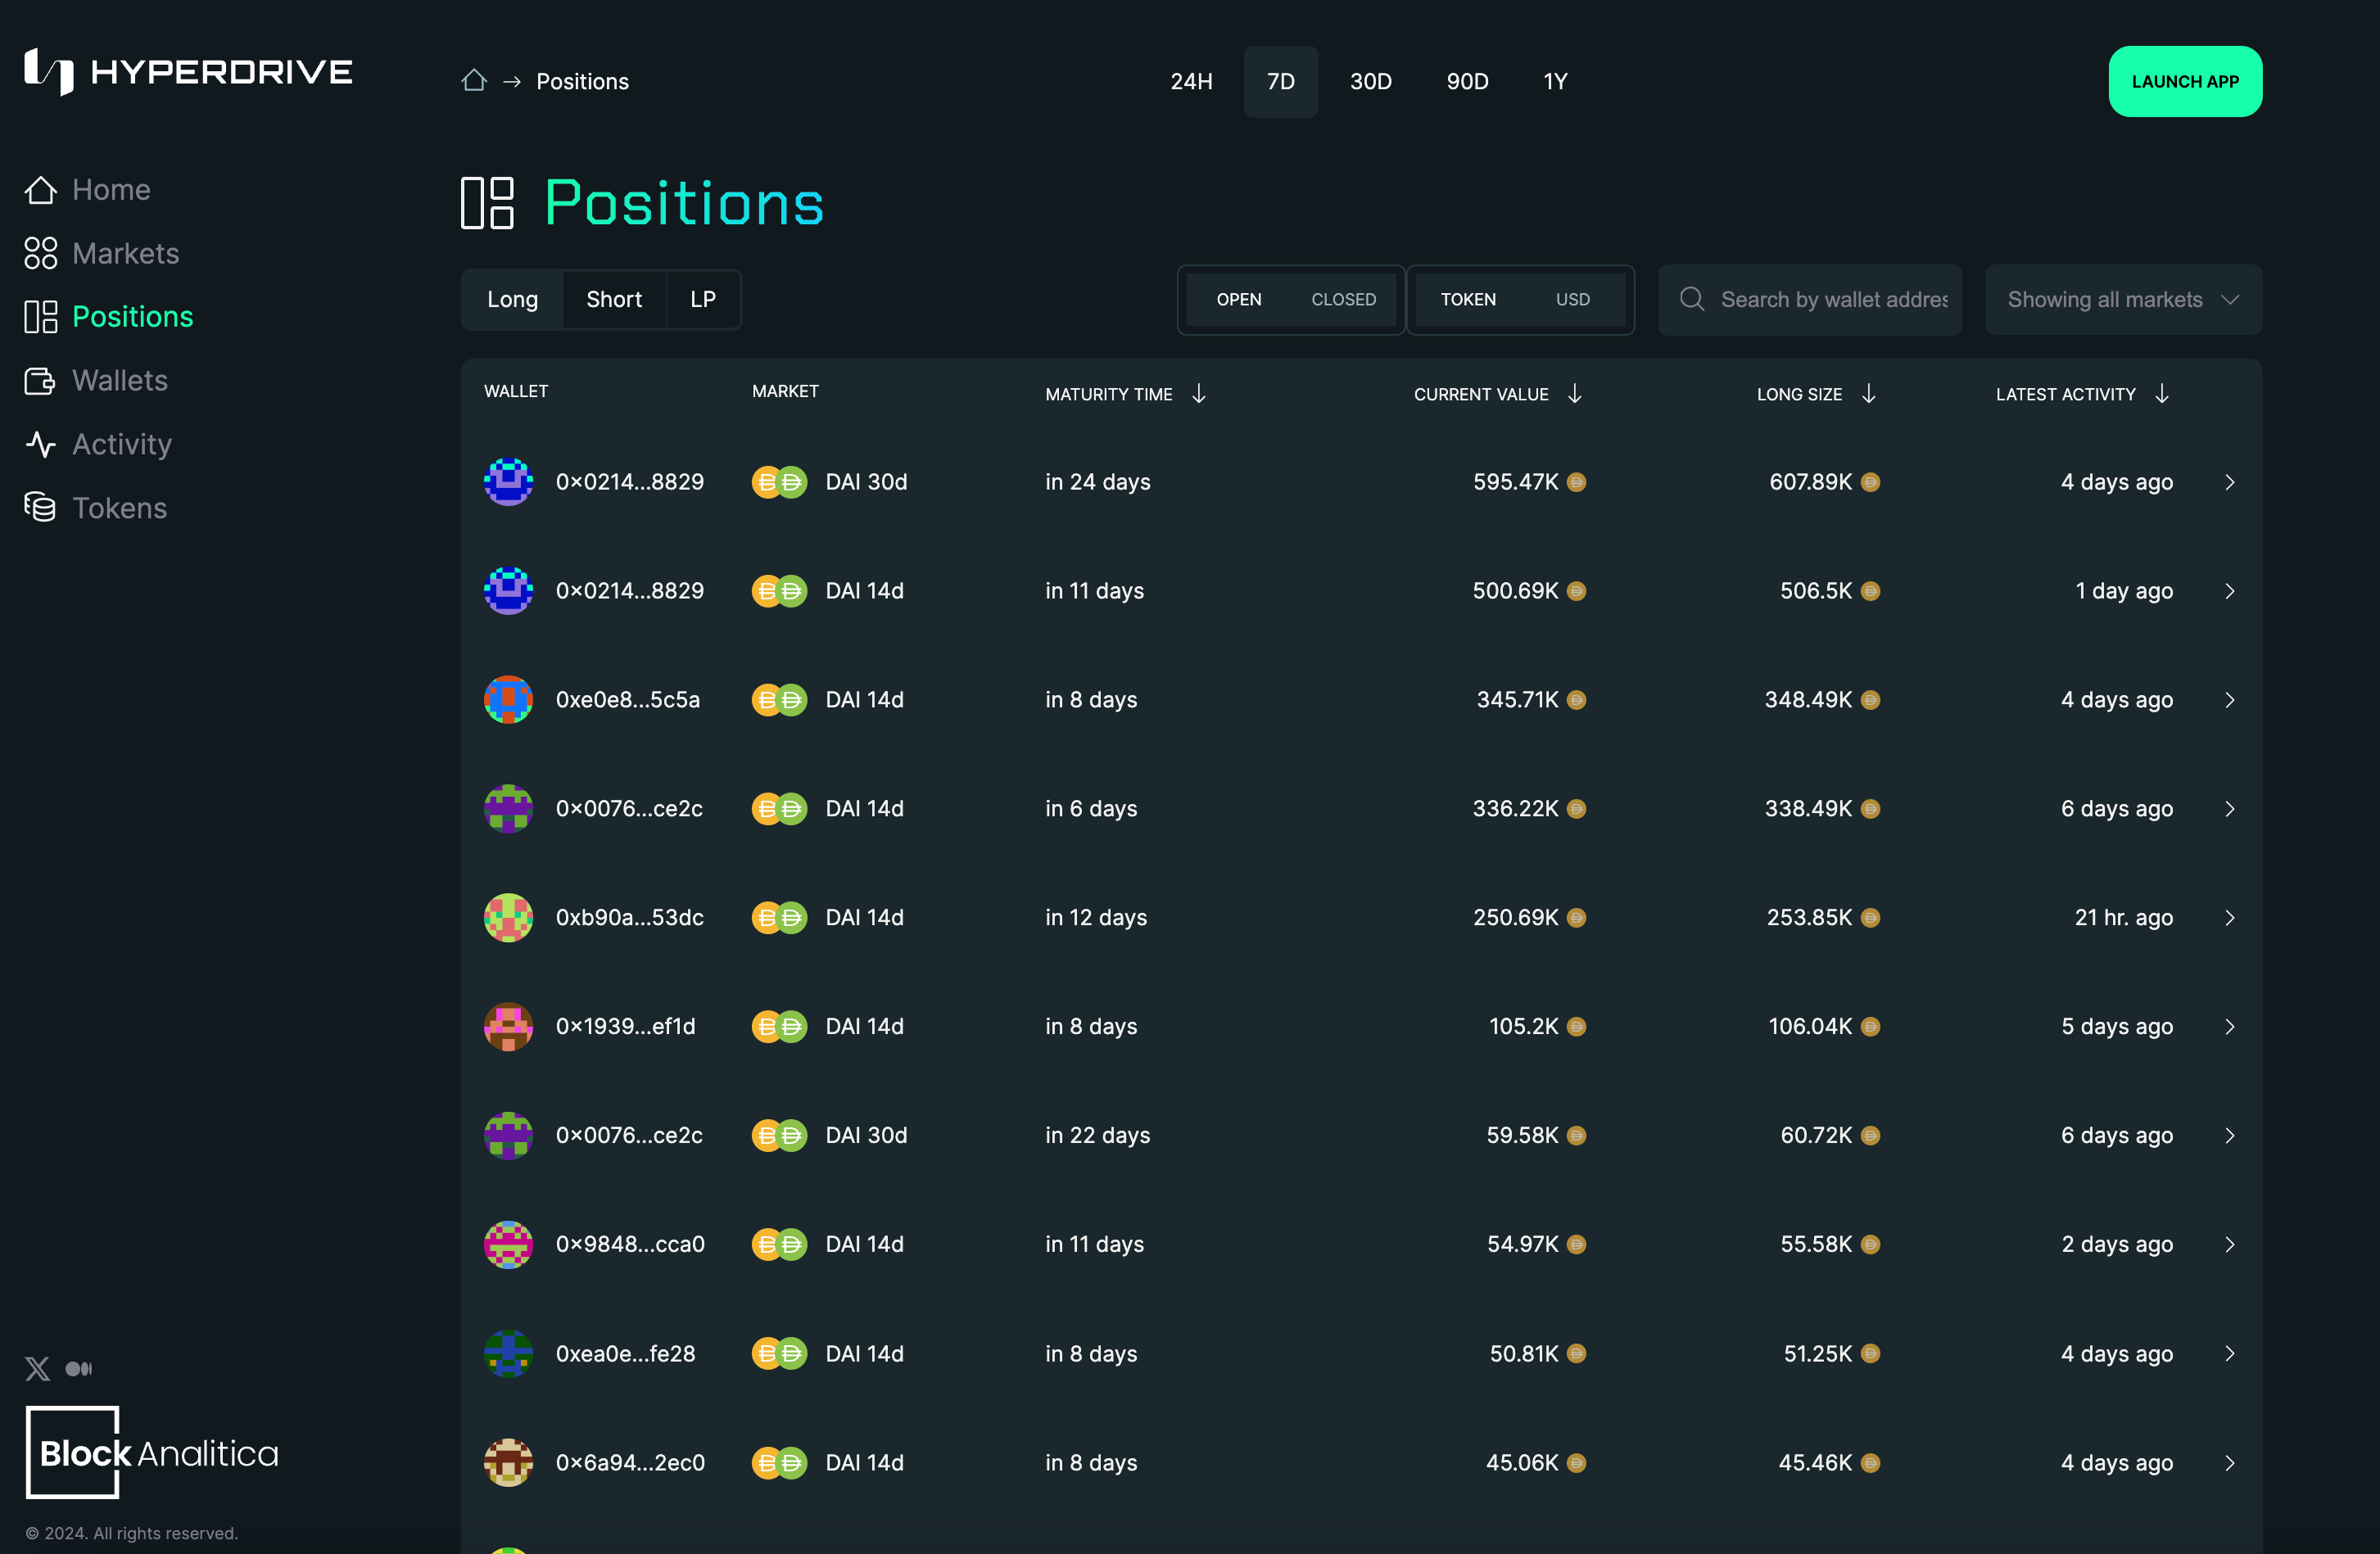
Click through a position to get additional details including current value and position PnL.
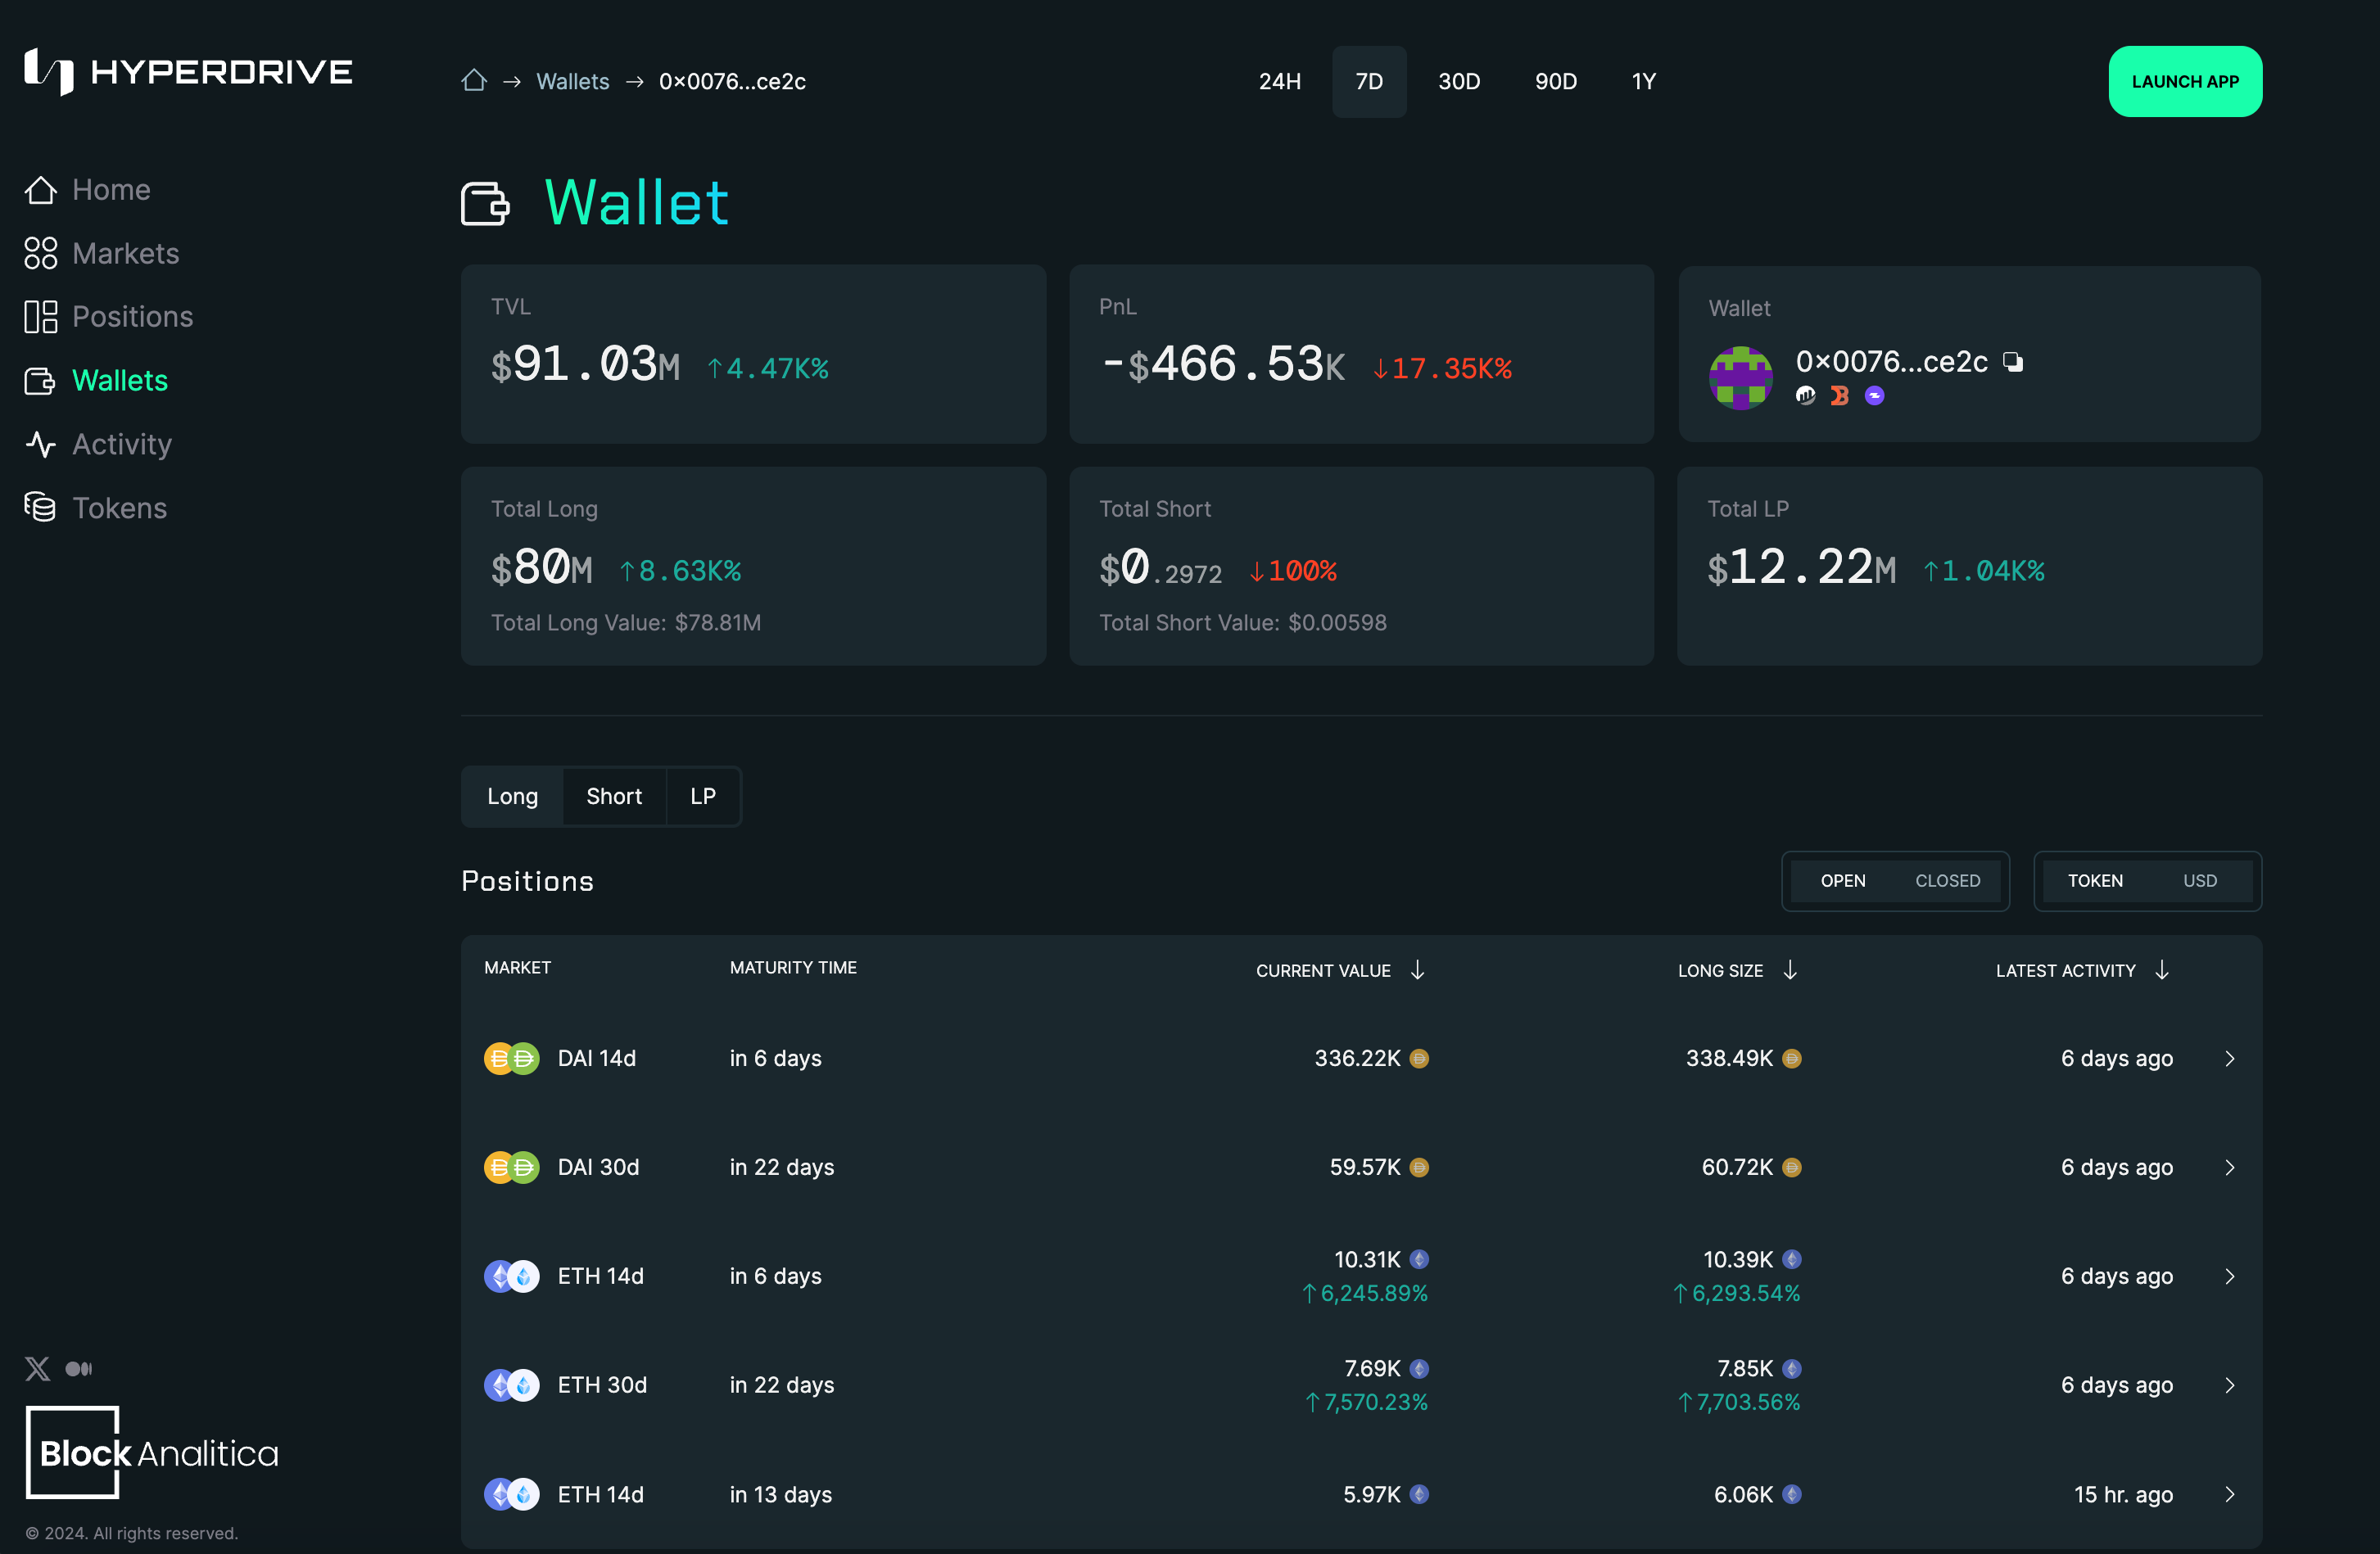
Wallets
On the Wallets page you’ll be able to track which user wallets are TVL heavy-weights and uncover alpha by identifying those that are highest performing. Which markets are they active in? What trading strategies do they appear to be employing?
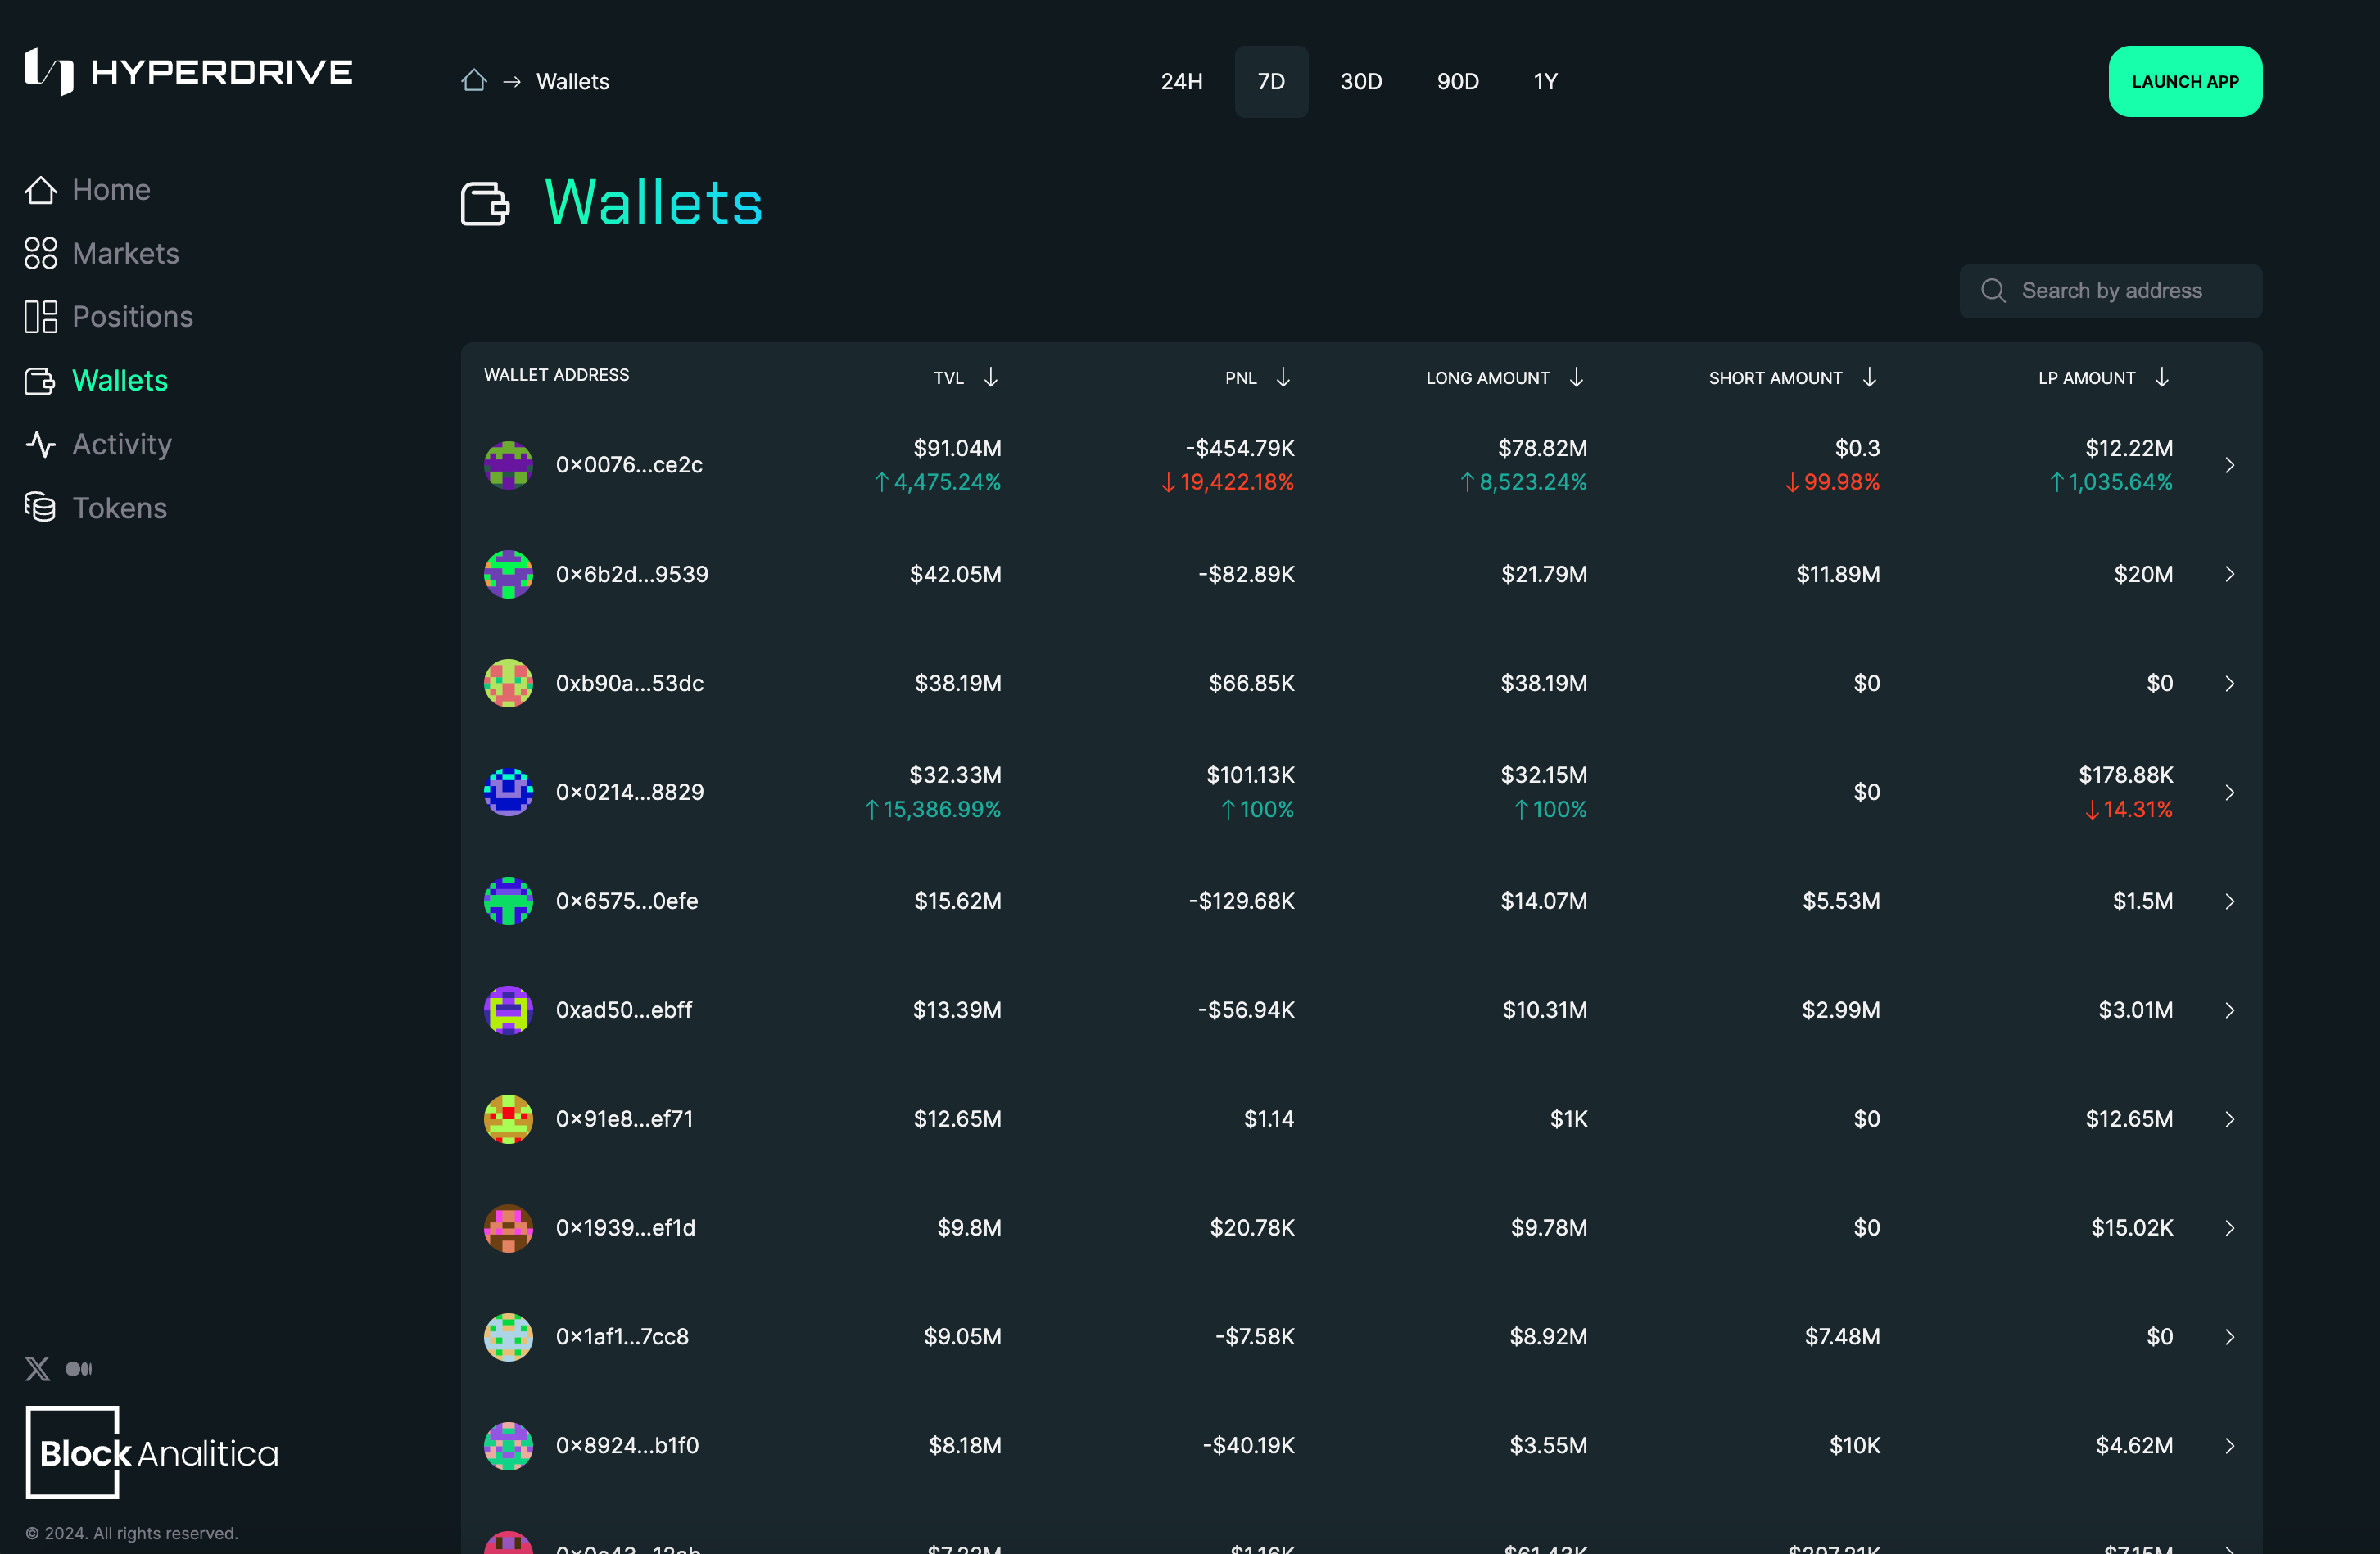
Click through a wallet to see trading activity by position type and start to uncover patterns and trading behavior that could point to a specific strategy.
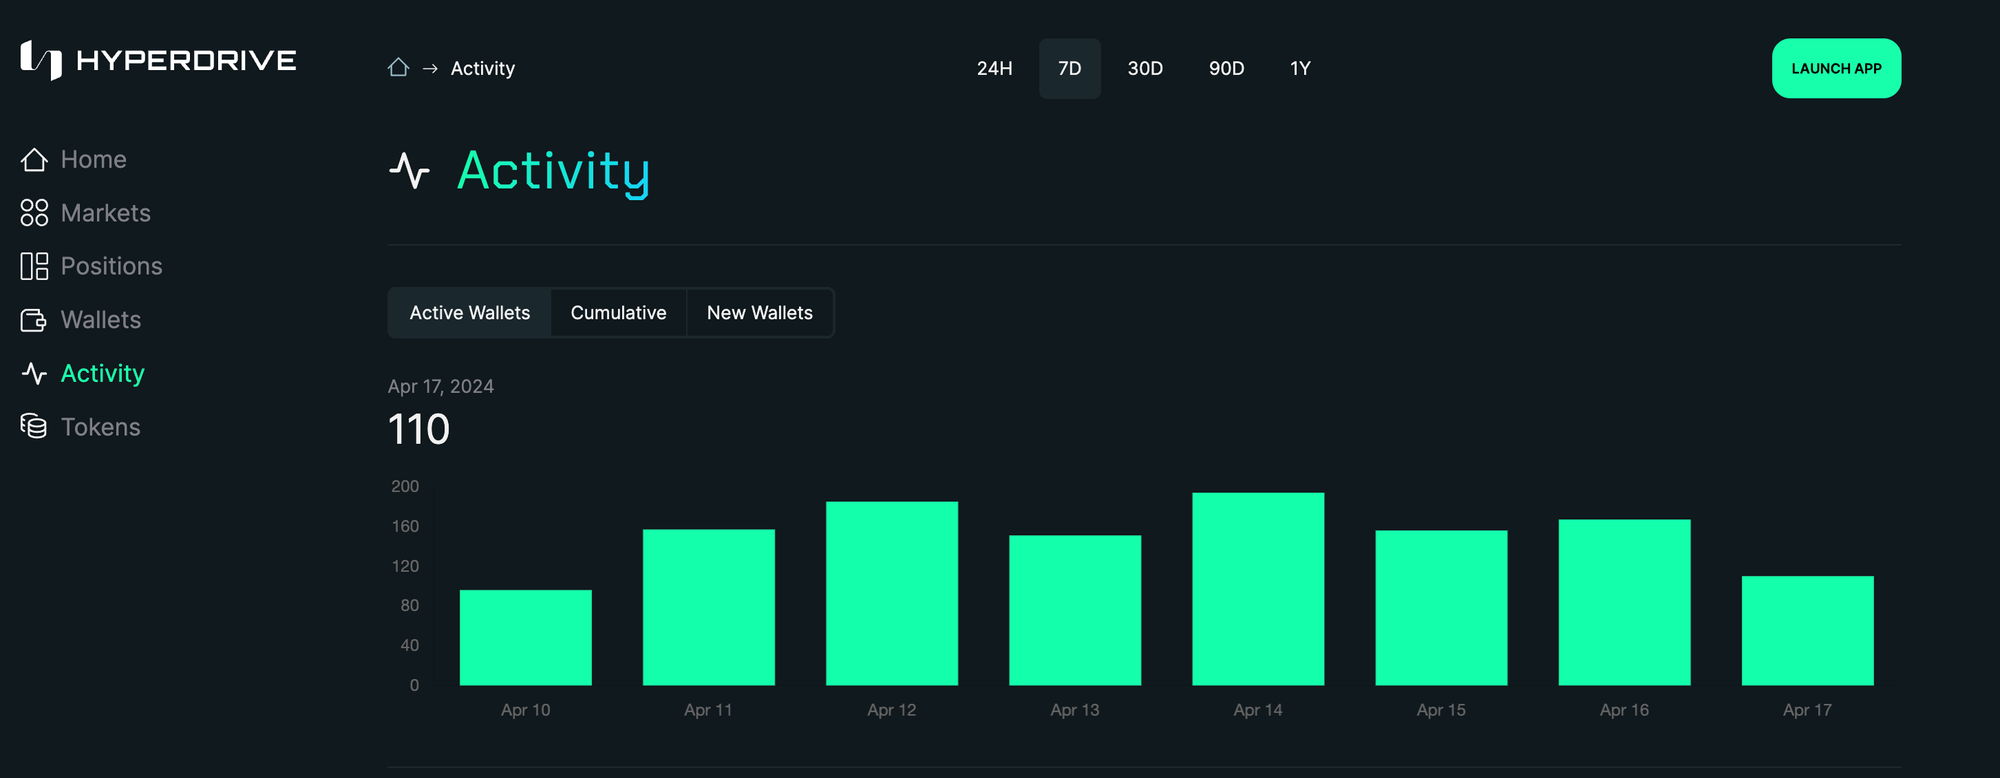
Activity
On this page, you can view Active, Cumulative, and New wallets that have interacted with the Hyperdrive Protocol. Hovering over each bar in the chart will present time-specific data. Quick reminder, the data displayed in most charts in the dashboard are tied to the global time frame selector at the top in the page header.
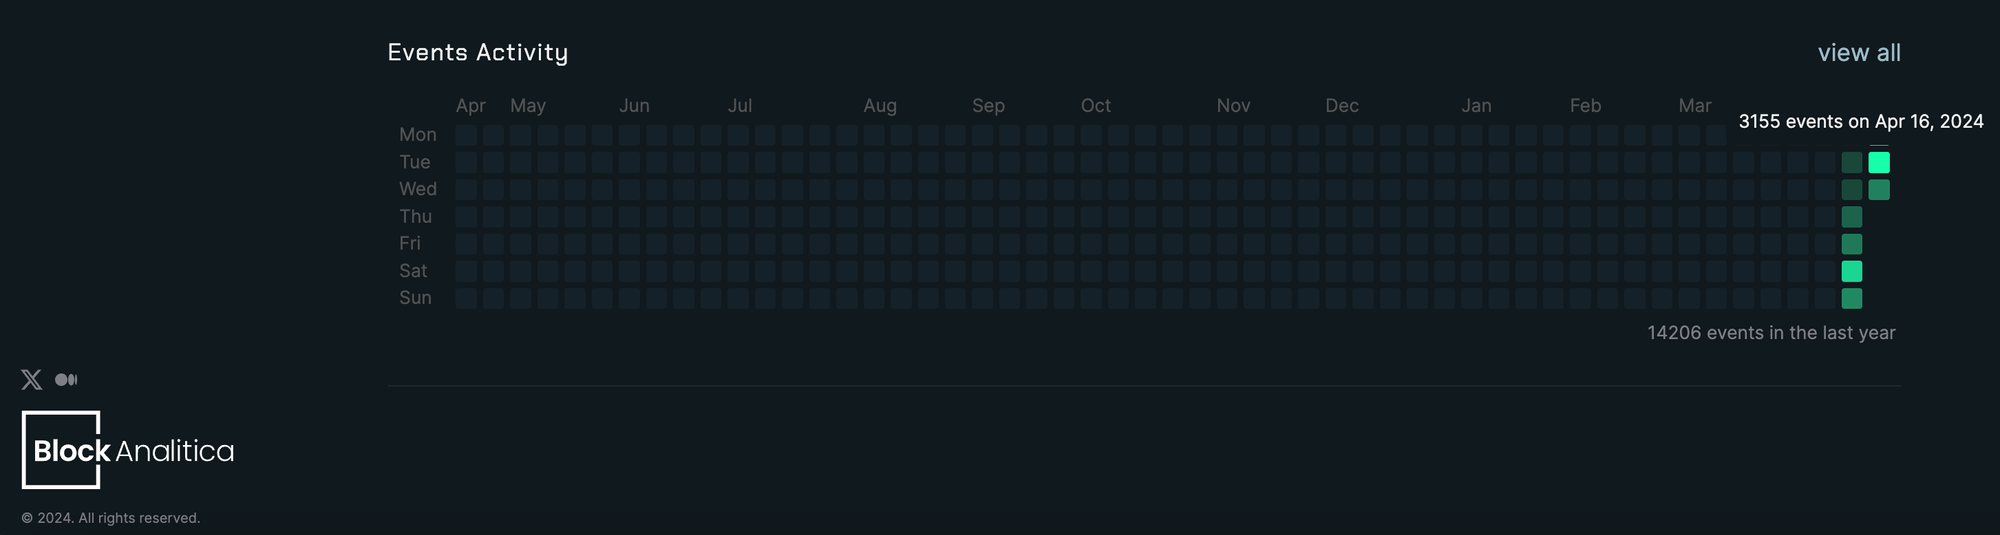
The Events Activity data visualization is a heat map of sorts showing the intensity of activity for each day. Hover over each green/active square to see how many events (i.e. protocol interactions) there were on any given day.
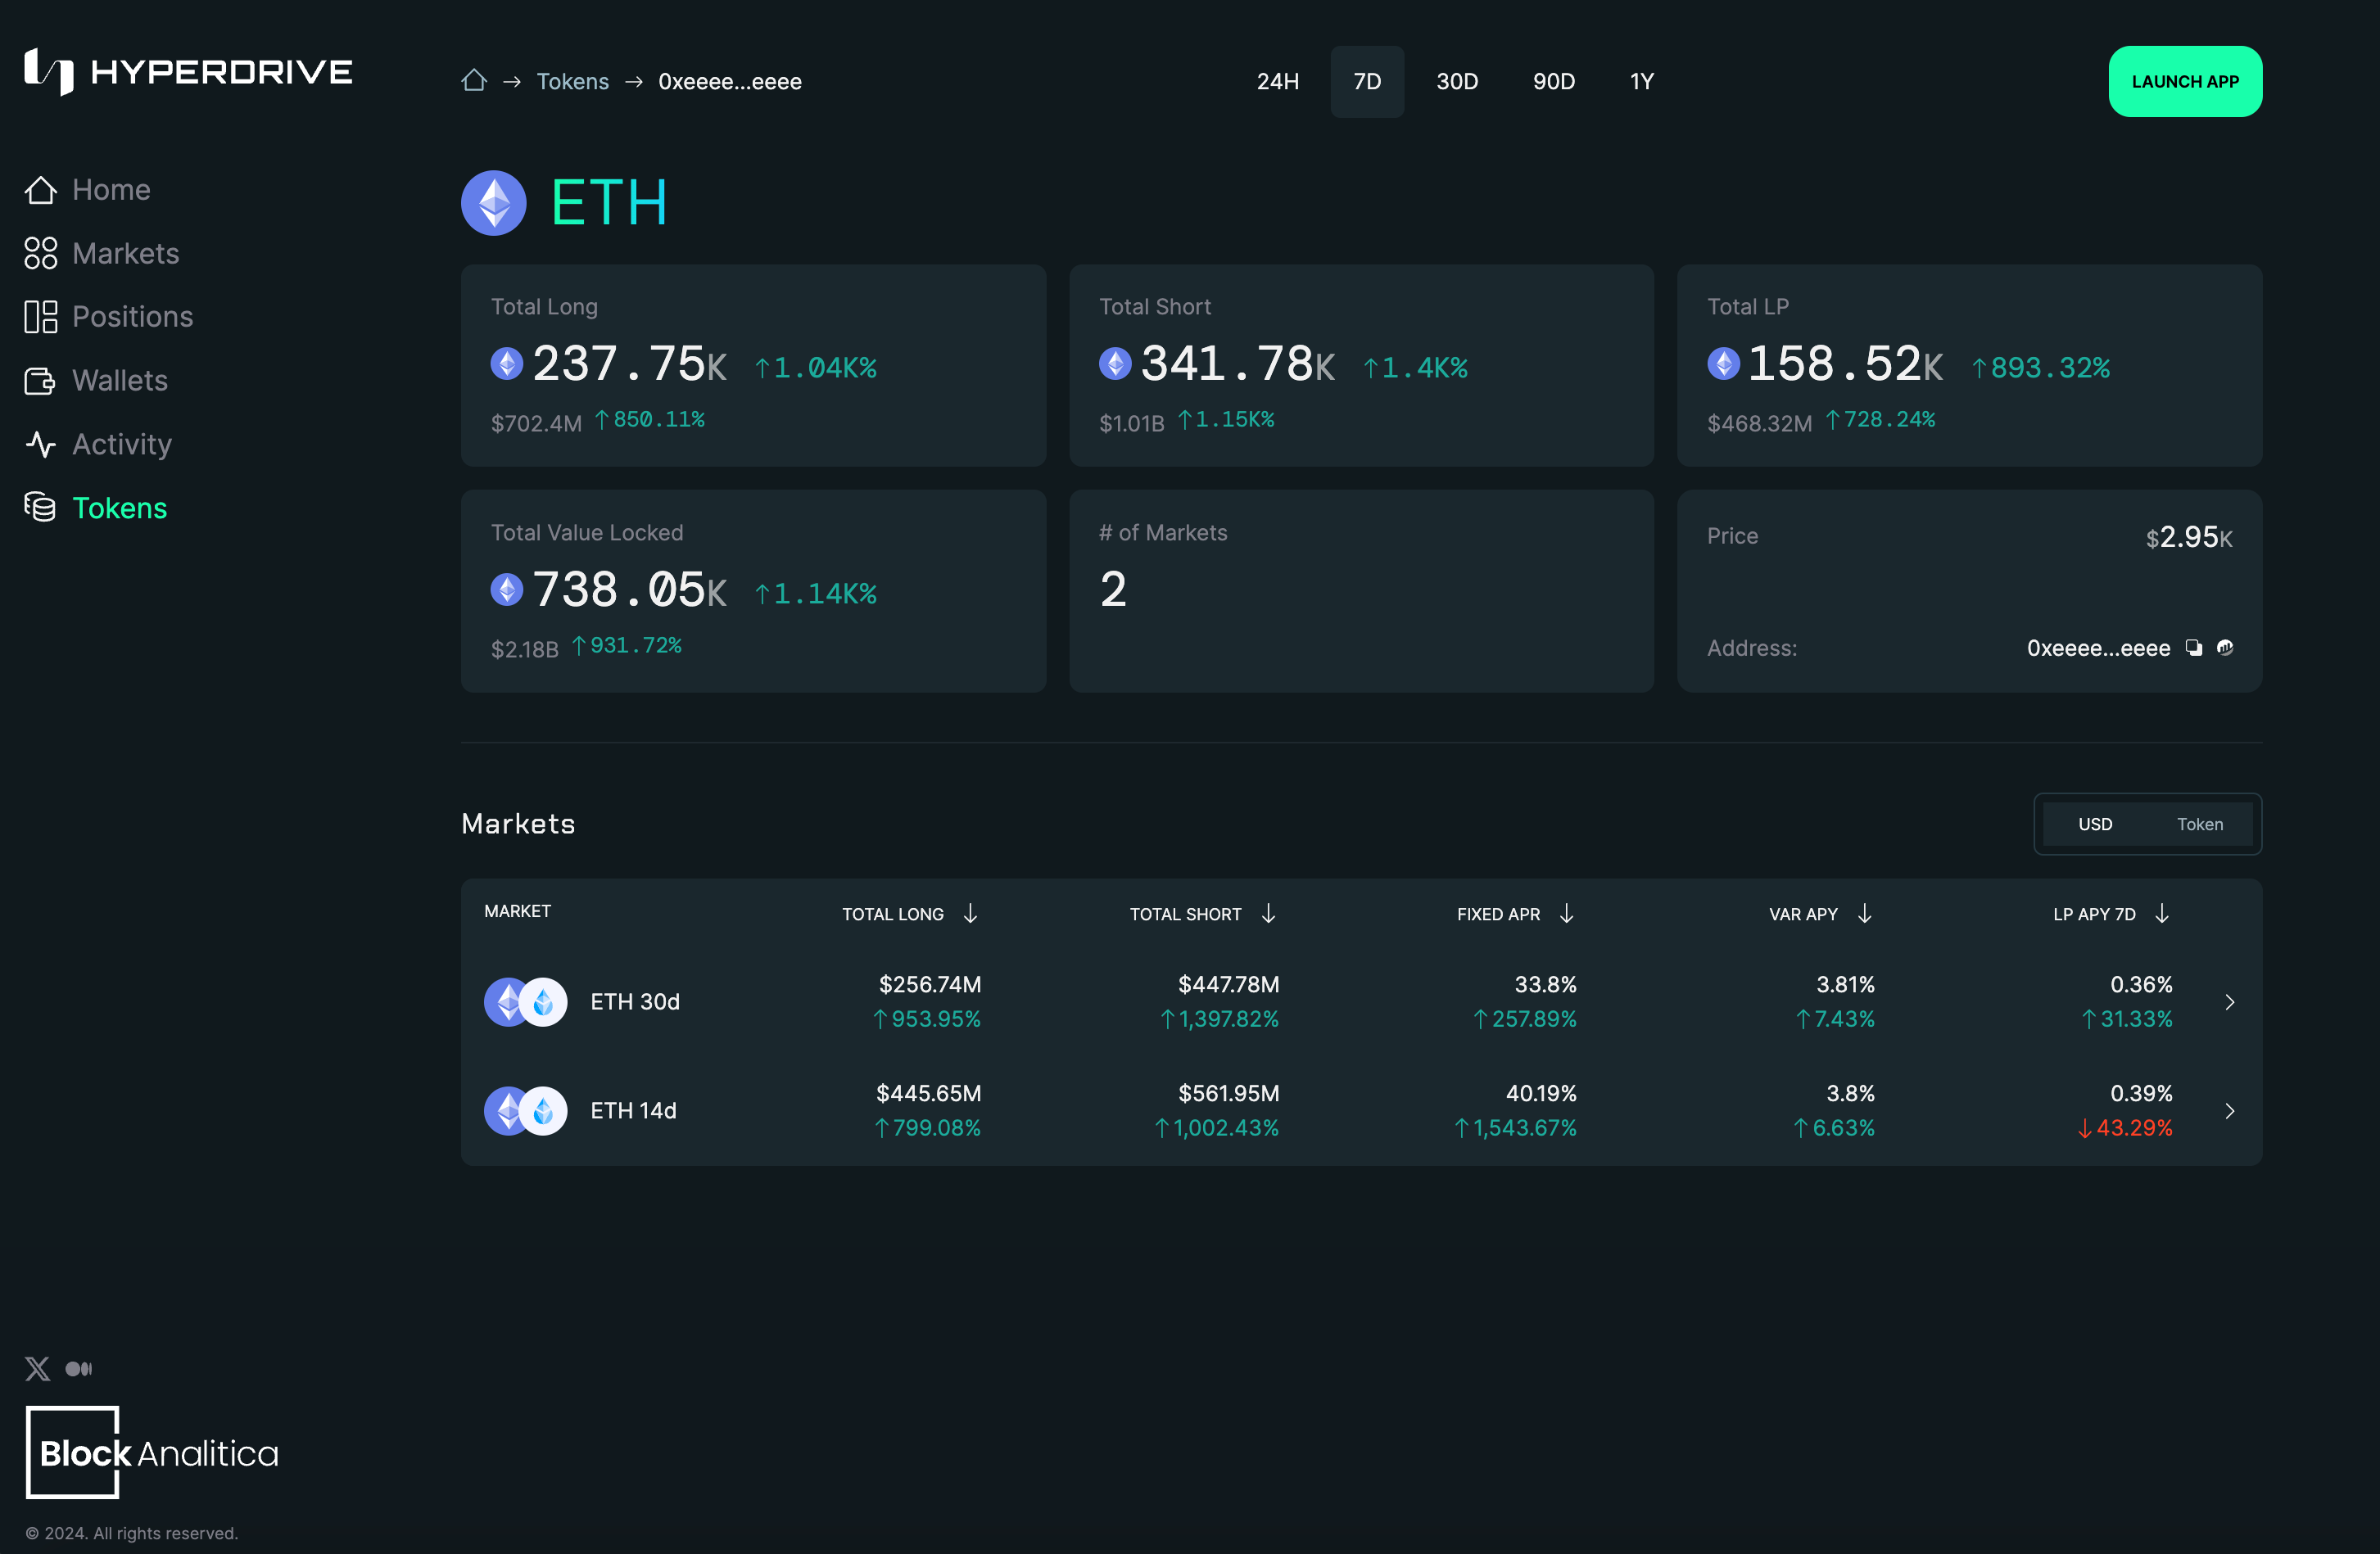
Tokens
Check out the Tokens page to view supported asset-specific metrics – currently, ETH and DAI.
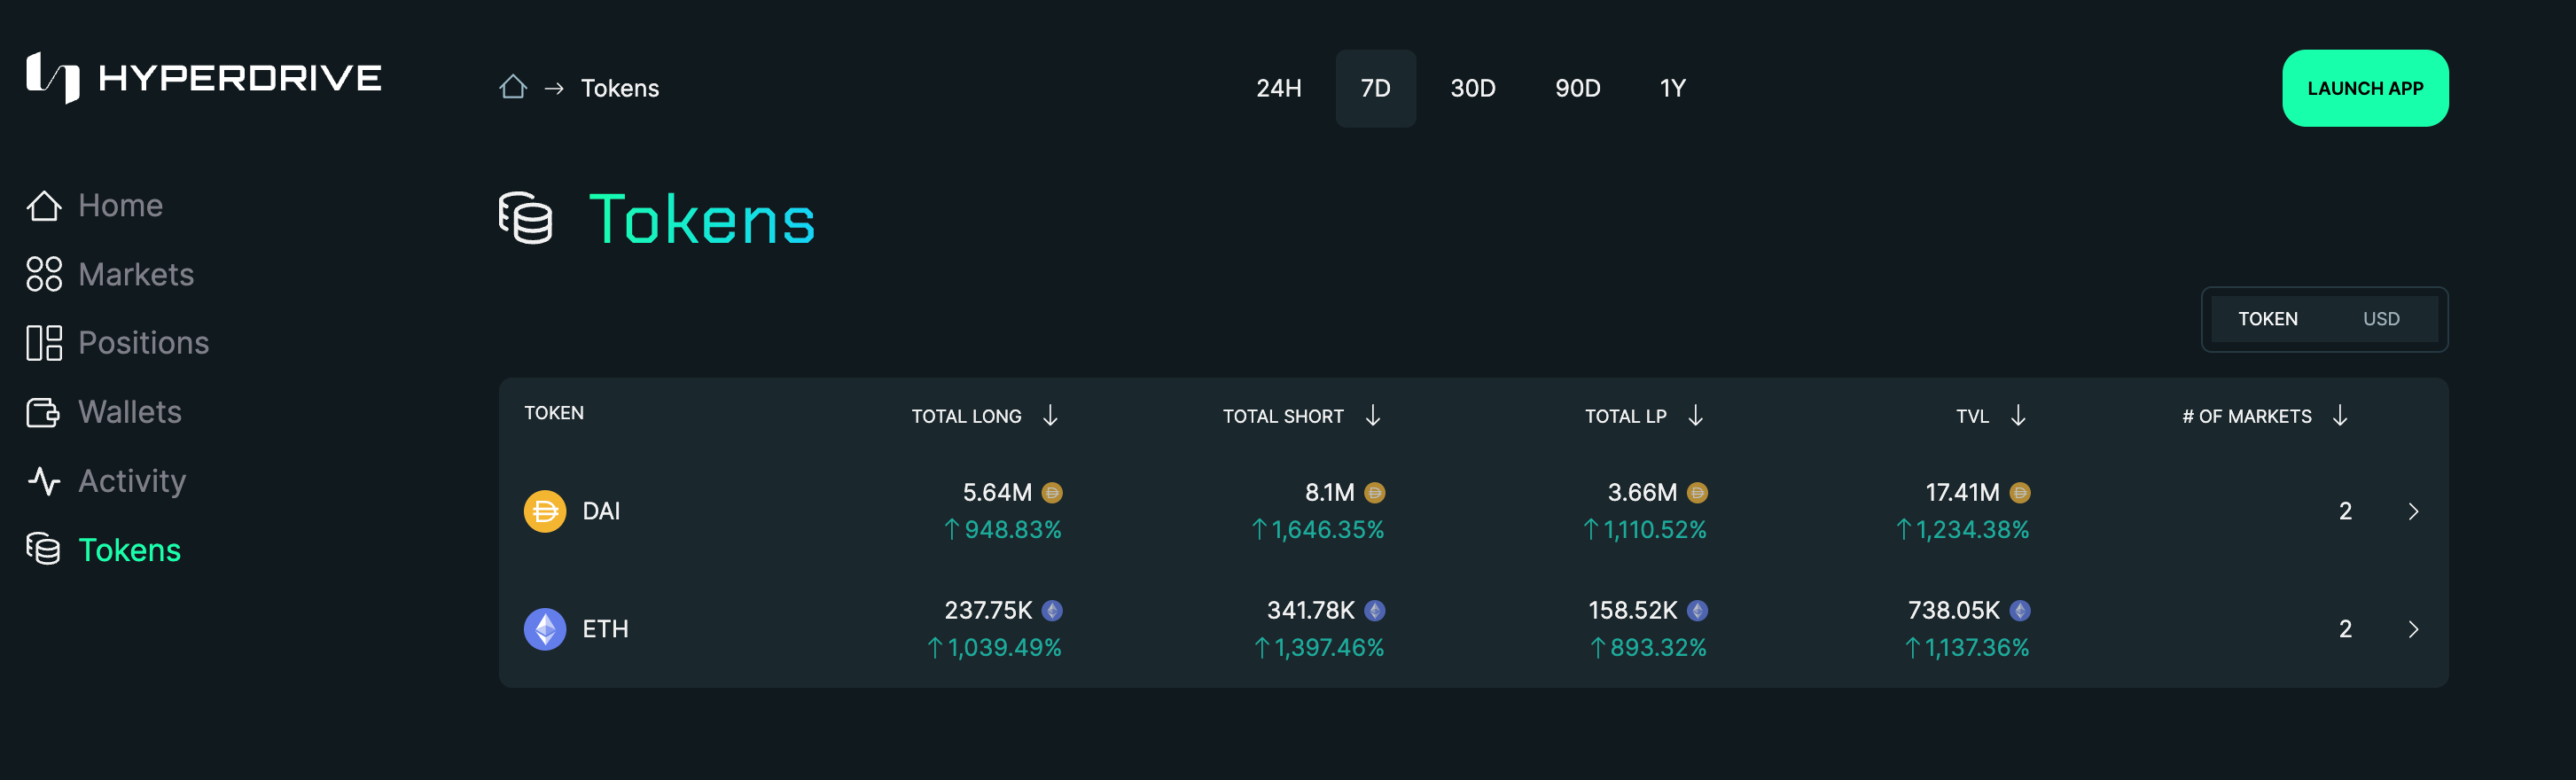
Click through each token to see more details.
What’s Next?
We’ll be working with the Block Analitica team to add new features and make continuous improvements to the dashboard through testnet in preparation for a mainnet launch. If you have ideas for new metrics or data visualizations you’d like to see, or general improvements or bugs to report, join our discord and chime in, we’d love to hear from you!
Here’s what you can expect over the next few weeks from us:
- Discussions of Hyperdrive with the DeFi community
- Further content and guides delving into the Hyperdrive Testnet
- A continuous public bug bounty program
- Incorporated feedback received from the Hyperdrive Testnet (UI, Docs, Code, etc.)
- Working with users, integrators, and builders in preparation for a mainnet launch of Hyperdrive
Join us on the Road to Launch Hyperdrive
Connect with us to stay updated on the latest news and developments:
- Twitter: @delv_tech
- Telegram: Delv Announcements TG
- Discord: delv.tech/discord
- GitHub: delvtech
Stay tuned for more updates and join us as a user, integrator, builder, or supporter as we gear up for the next launch!
Sincerely,
DELV Team